Net Order Imbalance
Note: Net Order Imbalance is available for NYSE and NASDAQ subscribers with the Market Depth Total View add-on service. Net Order Imbalance is updated 15 minutes prior to open and 15 minutes before the close. This service is not available with NYSE Market LLC (formerly AMEX).
Introduction to Net Order Imbalance
In 2004, NASDAQ introduced the Opening Cross and the Closing Cross -- price discovery facilities that cross orders at a single price at the beginning and the ending of the regular market session. The NASDAQ Crosses enable market participants to execute on-open and on-close interest and provides unparalleled transparency. Since the launch, market makers and other industry professionals have repeatedly demonstrated their willingness and ability to offset imbalances that are entered into the cross.
Beginning in late July 2005, eSignal began giving its TotalView subscribers access to the enhanced supply and demand data related to the NASDAQ crosses. This data -- known as the Net Order Imbalance Indicator -- provides a preview of forces that will affect the stocks opening and closing prices. This data reveals trading opportunities not visible anywhere else in the market and allows traders to further enhance their trading performance. This data is increasingly being viewed as critical for anyone trying to open or close positions near the beginning or the end of the trading day. As with all of the TotalView data, trading without it is like trading with one eye closed. For more information on trading with NASDAQ TotalView's market depth and speed advantages over legacy NASDAQ Level 2 data
Understanding How NOI is used
To better understand the ways in which the Net Order Imbalance Indicator can be used, it's important to first understand how the NASDAQ Crosses work. To summarize:
The NASDAQ Opening and Closing Crosses provide accurate and consistent opening and closing prices for NASDAQ-listed issues. Additional features of the crosses include:
1. Enhanced transparency and execution choices prior-to and at the open, as well as prior-to and at the close
2. A true price discovery facility that represents supply and demand in the marketplace.
3. A facility to resolve natural order imbalances in critical events, such as expiration dates for index futures and options.
How the Cross Works
The NASDAQ Cross enables market participants to execute on-open and on-close interest in a robust price discovery facility.
· NASDAQ accepts on-open order types that are executable only during the Opening Cross and on-close order types that are executable only during the Closing Cross.
· Leading up to the crosses, NASDAQ disseminates information about any order imbalance that exists among orders on the opening and closing books, along with indicative opening and closing prices.
· In the crossing process, the opening book and the NASDAQ continuous book are brought together to create a single NASDAQ Opening Cross, which occurs at 9:30 a.m., ET. Likewise for the closing cross; the NASDAQ Closing Cross occurs at 4:00 p.m., ET.
· NASDAQ opening and closing prices are distributed to the industry immediately after each Cross occurs.
Order Types
1. On-Open (OO) and On-Close (OC) Orders: Market-on-open (MOO) and limit-on-open (LOO) orders allow investors to specifically request an execution at the opening price. Similarly, Market-on-close (MOC) and limit-on-close (LOC) orders allow investors to specifically request an execution at the closing price. For the purposes of the opening cross, regular hours orders entered prior to 9:28 are treated as on-open orders.
2. Imbalance-Only (IO) Orders: Priced orders that provide liquidity to offset OO and OC orders during the Crosses and only execute at or above/below the 9:30 a.m. E.T. and 4:00:00 p.m. E.T. NASDAQ offer/bid. More aggressively priced IO orders are re-priced to the NASDAQ Inside prior to execution of the Cross.
Net Order Imbalance (NOI) in the Market Depth Window
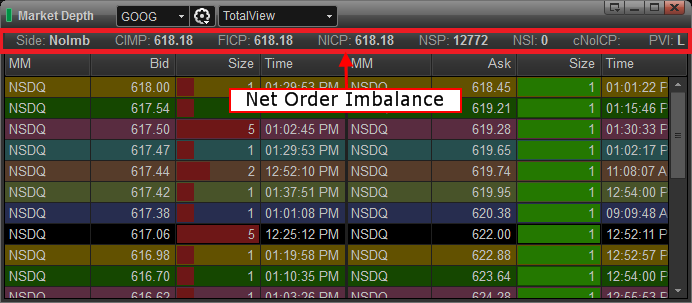
Net Order Imbalance will be displayed at the top of a Market Depth Window. 
Adding NOI to a Market Depth Window
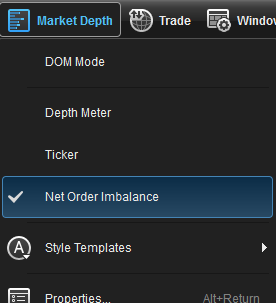
To add the Net Order Imbalance Indicator to your Market Depth Window, click on the Market Depth menu at the top of eSignal and select Net Order Imbalance.
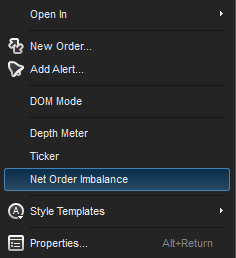
An alternate method for accessing this feature is by right-clicking in the main body of the Market Depth Window, and selecting Net Order Imbalance. 
NOI in the Watch List Window
Net Order Imblance is no longer restricted to just the Market Depth Window. You can now add the Net Order Imbalance data columns into a Watch List. Please keep in mind that access to this feature requires access to Market Depth TotalView.
Adding NOI to a Watch List
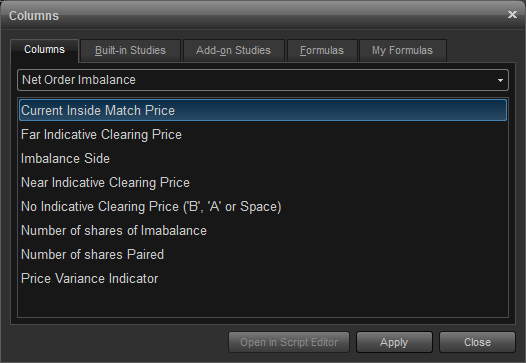
To add the Net Order Imbalance columns to a Watch List, right-click the mouse over an existing field and select Add Columns. The Columns Dialog box will appear with a list of available columns. Select Net Order Imbalance in the drop down menu as shown below to see a list of available columns. Highlight the columns you wish to add and click Apply. 
NOI Columns Descriptions
Imbalance Side (Side)
B Buy-side imbalance
S Sell-side imbalance
Nolmb No imbalance (buy side equals sell side)
O No marketable on-open (or on-close) orders in NASDAQ, thus no imbalance.
Current Inside Match Price (CIMP)
The Current Inside Match Price reflects the price for which the number of Paired Shares and the number of Imbalance Shares are calculated. Please note that the Current Inside Match Price is determined by the price within the NASDAQ Inside where the maximum number of shares are paired, the imbalance is minimized and the distance from the bid-ask midpoint is minimized, in that order. If this field is null or blank, it is because there is no Current Inside Match Price for the specific security.
Far Indicative Clearing Price (FICP)
This field indicates the price level at which buy orders and sell orders match in the opening/ closing book. If this field is null or blank, this indicates one of two circumstances:
• There are no on-open (or on-close) orders entered for the security; or
• There is no substantial on-open (or on-close) interest on the opposite side of the market to execute all of the MOO (or MOC) orders on the other side. When this occurs, the No Indicative Price field displays either a Market Buy or Market Sell indicating that offsetting imbalance only orders should be entered on the other side of the market.
For the midday opening process, the Current Inside Match Price, the Near Indicative Clearing Price and the Far Indicative Clearing Price will be equal.
Near Indicative Clearing Price (NICP)
The crossing price at which orders in the NASDAQ opening/closing book and continuous book clear against each other. If this field is null or blank, this indicates one of two circumstances:
• There are no on-open (or on-close) orders entered for the security; or
• There is no substantial on-open (or on-close) or continuous book interest on the opposite side of the market to execute all of the MOO (or MOC) orders on the other side. When this occurs, the No Indicative Price field displays either a Market Buy or Market Sell indicating that offsetting imbalance-only or continuous market orders should be entered on the other side of the market.
For the midday opening process, the Current Inside Match Price, the Near Indicative Clearing Price and the Far Indicative Clearing Price will be equal.
Number of shares Paired (NSP)
The total number of shares that are eligible to be matched at the Current Inside Match Price.
For the Opening Cross, this calculation will include early "Regular Hours", Market On Open, Limit On Open, and Imbalance Only orders that are eligible to be matched at the Current Inside Match Price.
For the IPO and trading halt opening process, this calculation would include regular hour orders and quotes that are eligible to be matched at the Current Inside Match Price.
For the Closing Cross, this calculation will include Market On Close, Limit On Close, and Imbalance Only Orders that are eligible to be matched at the Current Inside Match Price.
The Number of Shares Paired may be zero-filled under the following two scenarios:
• There are no on-open/on-close orders in the NASDAQ book. In this case, the Imbalance Side field would be set to “O”.
• There are no shares in the eligible order types that match at the Current Inside Match Price
Number of shares Imbalanced (NSI)
For the Opening Cross, this field indicates the absolute difference between the number of shares for early “Regular Hours”, Market On Open, Limit On Open and Imbalance Only orders on the buy side and the number of shares for early “Regular hours”, Market On Open, Limit On Open and offsetting Imbalance Only orders on the sell side eligible to be matched at the Current Inside Match price.
For the IPO and trading halt opening process, imbalance information will only be disseminated when there is a Market Buy or Market Sell condition.
For the Closing Cross, this field indicates the absolute difference between the number of shares for Market On Close, Limit On Close and offsetting Imbalance Only orders on the buy side and the number of shares for Market On Close, Limit On Close, and offsetting Imbalance Only orders on the sell side eligible to be matched at the Current Inside Match Price.
For the opening and closing crosses, the Number of Shares of Imbalance may be zero-filled under the following scenarios:
• There are no on-open/on-close orders in the NASDAQ book. In this case, the Imbalance Side field would be set to “O”.
• There is no imbalance; all shares in eligible orders can be paired at current inside match price. In this case, the Imbalance Side would be set to “Nolmb”.
Price Variance Indicator (PVI)
This field indicates the absolute value of the percentage of deviation of the Near Indicative Clearing Price to the nearest Current Reference Price.
Price Variance Indicator = (Near Indicative Clearing Price – Current Inside Price)
This field indicates the % difference between the indicative Opening/ Closing Cross price (Near Clearing Price) and the price where the market is currently trading. A high value indicates there will be a large price difference between the Opening/ Closing Cross price and the continuous market if sufficient offsetting interest is not entered. This field will display a percent difference or percent range as listed below:
| Code | Percentage Range |
| L | Less than 1% |
| 1 | 1 to 1.99% |
| 2 | 2 to 2.99% |
| 3 | 3 to 3.99% |
| 4 | 4 to 4.99% |
| 5 | 5 to 5.99% |
| 6 | 6 to 6.99% |
| 7 | 7 to 7.99% |
| 8 | 8 to 8.99% |
| 9 | 9 to 9.99% |
| A | 10 to 19.99% |
| B | 20 to 29.99% |
| C | 30% or greater |
| Space | Cannot be calculated |