Advanced Charting - Bar and Tick Replay Tools
Bar Replay
Tick Replay / Downloader
EFS Considerations
Bar Replay
The purpose of this tool is to give you a way to move to a previous point in time and have the chart react as if that point is current. It lets you test your formulas and strategies with a full days worth of data without needing to wait for things to play out in Real-time. You can make adjustments to a custom formula or change the set of indicators you're using and then just go back and replay the data again. You can then watch how the indicators react and see if expected trends play out as the chart steps forward. This helps you fine tune everything to be ready for the next day of trading.
To get to the Bar Replay Tool, right click on an advanced chart, select tools, and then select Enter Bar Replay Mode. You can also click on the tools option on the main menu, select Bar Replay, and then Enter Bar Replay Mode.
| What does each button on the Bar Replay toolbar do? | ||||||||||||||||||||
| ||||||||||||||||||||
Using the Bar Replay Feature
Click on the curved green arrow called "Jump to a bar" and select a point in time you would like the chart to react as if that point is current. The chart will now move as it did when the market was open. You can then set a replay period from 1/2 second to 20 seconds and then click the Play button to watch the chart add bars at the rate selected. You can also step one bar at a time forward or backward by using the Replay Toolbar.
Stopping the Bar Replay Feature
There are a few things you can do. One option is to click on the pause button. This will automatically stop the data. You can then click the play button again to continue. Another option is to click on the "Go to a real time chart" button (right facing arrow with line in front of it). This will take you back to the real time chart. The last option you have is to simply click on the red X button. This stops the replay function and also closes out the toolbar.
Using Formulas or Studies with the Bar Replay Tool
You can at any time add or remove a study or formula when in replay mode. This is true even when you click the Play button. All studies and formulas will calculate when a bar is either subtracted, added, or if you use the Jump To A Bar tool. This is true even when you click the Play button.
Using Drawing Tools in Bar Replay Mode
Drawing tools will react normally in Replay Mode. If you subtract a bar from the data set that a drawing tool was drawn on, the line will stay on the chart where it was originally drawn from. Lines are not removed from the chart once they are placed on the chart, unless you choose to remove them.
Manually Scrolling Through Bars in Bar Replay Mode
If you start the play mode using the Play toolbar button  you can still use the Go Forward
  and Go Back
  button to add/subtract bars from the data set. This will not stop the automatic play of the data set.
Getting Current Data in Bar Replay Mode
At the bottom right corner of the chart window will be a Go To Real Time Chart button  . You can click on this to change the chart back to real time mode without exiting Replay mode. Real time data will be displayed on the chart.
Decimal Display for Futures in Bar Replay Mode
eSignal software filters out Futures decimals from the raw exchange feed. If you use Tick Reply, you are downloading the raw exchange data. When you play it back, the Futures data is unfiltered by the eSignal software, therefore contains decimals.
Tick Replay / Downloader
The Tick Replay is similar to Bar Replay where the main difference is the data set. Tick Replay allows you to test your formulas and strategies in a simulated real-time environment on a tick-by-tick basis rather than completed bar data like the Bar Replay tool.
To get to the Tick Replay Tool, click on an advanced chart, select Tools fromthe main menu, and then select Tick Replay. You will see two option under the Tick Replay menu. Before selecting the Replay Tick File option, you need to have at least one tick data file. Select the Tick Downloader to create a tick data file.
using the tick downloader
after selecting the tick downloader, you will see the following window. enter the symbol for the tick data to wish to download and the number of days of tick data. the maximum number of days of tick data is 10. then click onthe button to the right of the file name: label, select the folder and enter a file name for the tick data file from the save data as epf file window that appears. these are the minimum requirements to download tick data. click the download button to begin the process.

During the download you will see some status information in the Status box. The image below is the message that appears when the download has completed.

tick downloader options
-
Start and End Time
If you wish to filter data outside a specific range of time, you can enter a start and end time for the range of data you want. -
Save Trades Only
By default the Tick Downloader will include quotes in the data file. This option will save only the trades to the tick data file. -
Price Adjustments - Price Base
The Price Base Option allows you to adjust the base price at the beginning of the tick data. The prices going forward reflect the same percentage change in price as the original tick data but start from the specified base price. -
Price Adjustments - Tick Factor
The Tick Factor is used in combination with the Price Base to convert equity data to look like another security, such as E-mini. For example, you could download IBM tick data with a price base of 108200 and a Tick Factor of 25. The first trade would start at 108200 and then for every .01 increment of IBM, the price would adjust by a factor of 25.
Using Tick Replay
Before starting the Tick Replay feature you must select an Advanced Chart so that it is the active window inyour page or layout. You will also set the chart interval to your desired interval for the replay. Then go to Tools from the main menu, select Tick Replay, and then select Replay Tick File. You will then be asked to select a tick data file. Navigate to the folder where you saved your tick data file. The file extensions for tick replay data files are .EPF. Select the file you wish to replay and select Open. The symbol of your advanced chart will become $PLAYBACK. This symbol tells the chart to use the tick data file you selected. At first, the Advanced Chart will be blank. You will use the Tick Replay window to start the replay.

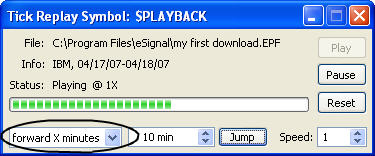
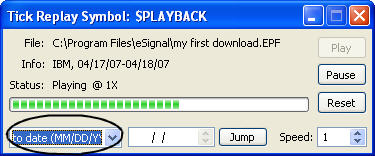
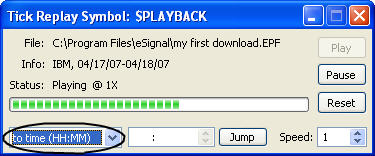
There are several ways to start the replay. You can simply click Play to start from the beginning of the data. You can also the Jump button to jump forward and start at a specific point in time. There are three options.
Jump Options
-
forward x minutes

select the number of minutes to jump forward in time.
-
to date

if there is more than one days worth of data, select to date and enter the mm/dd/yyyy to jump forward to. -
to time

selct to time and enter the hh:mm time to jump forward to.
Selecting a Jump option and clicking the Jump button will start the play. During the replay you also have the option to increase or decrease the speed of the replay as well as to pause or reset the replay. If you click the reset button, the replay stops. You will then need to restart byclick the Play button or selecting one of the Jump options. The speed option plays at the selected number times real time. A speed of 10 is approximately10 times real time.
Tick Replay on Forex Data
Please be aware that because the Forex market doesn't report trades, just bid/ask quotes, that Tick Replay doesn't currently replay Forex data. Until we can program a way for this to work natively within eSignal, we have a fairly complex work-around available. This post on the eSignal forums gives further information on this process.
EFS Considerations
Most EFS formulas will perform normally when used with Bar or Tick Replay. However, if the EFS formula requires access to data that is not part of the chart data in Bar Replay or the tick data file for Tick Replay, will not perform as designed. For example, formulas that request data of secondary symbols that are external to the current chart's symbol, or tick data symbol, are not available in replay mode. Formulas that also require the use of the getMostRecentXXX() EFS functions will not work in replay mode because these functions only return valid data in real time mode. The data for these functions is not available on a historical basis currently.
