eSignal 10.6 - Hot Lists
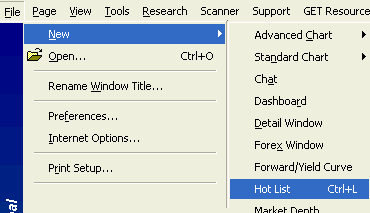
starting with version 10.5, hot lists have now replaced the leaders window and will provide far more information on what's moving in the us markets. a hot list window can be opened several ways. you can choose file, new, hot lists or press ctrl-l. 
you'll also find a hot lists icon on the main tool bar (you'll see a green arrow up and a red arrow down). in older versions of esignal this icon was used for the market leaders window which has since been replaced with hot lists. 
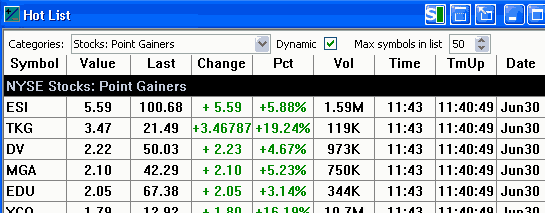
you may request any number of results from 1 to 100 for each list. you can also choose to have the list of results updating dynamically (i.e. streaming and hence counting as active symbols) or static mode (where they don't count against symbol limit). check or uncheck the dynamic box to toggle between the two settings. 
hot lists automatically update every 30 seconds. to avoid the inclusion of thinly traded equities, only equities that trade at least 100,000 shares with at least 50 transactions will be included in the results, although some exceptions may apply. hot lists begin to calculate at market open (9:30 am et) with some lists continuing to update with post market activity (nasd trade rate for ex). pre-market activity is not included.
hot lists exclusions: nano-cap stocks
over the last few years, hot lists have been quite popular as these quick market scans help to generate lists of stocks for clients to watch during a trading day. we have received a lot of positive feedback on this feature, and in 2011 we expanded it to include the canadian and etf markets. one piece of feedback we continue to receive is that small companies are getting in the way of the important movers and shakers.
U.S. Stocks under a $50M Market Cap. (typically referred to as "Nano-cap Stocks") are excluded from the Hot Lists.
Canadian Markets - TSX and CAN symbols under a $25M Market Cap. and TSX Venture stocks with less than a $10M Market Cap are excluded.
Hot List Descriptions
Below are short descriptions of each list type.
US Stocks Point Gainers: |
Stocks with the largest positive Net change from yesterday's close |
US Stocks Point Losers: |
Stocks with the largest negative Net change from yesterday's close |
US Stocks Pct Gainers: |
Stocks with the largest positive Net percentage change from yesterday's close |
US Stocks Pct Losers: |
Stocks with the largest negative Net percentage change from yesterday's close |
US Stocks Volume Stocks: |
with the highest number of shares traded today |
US Stocks Volume Rate: |
Stocks with the most number of shares traded in the last minute (based on 65-day avg daily volume) |
US Stocks Trades: |
Stocks with the most number of transactions recorded today |
US Stocks Trade Rate: |
Trade Rate: Stocks with the most number of trades in the last 30 seconds (part of calculation based on 65-day avg daily volume) |
US Stocks Very Short Term Up: |
Stocks whose current price is farthest above the extreme low price of the last fifteen minutes |
US Stocks Very Short Term Down: |
Stocks whose current price is farthest below the extreme high price of the last fifteen minutes |
Stocks with the largest percentage difference between today's high and low |
|
US Stocks Largest Range: |
Stocks with largest net difference between today's high and low (or yesterday's close, if outside today's range) |
US Stocks Unusual Volume: |
Stocks whose volume today is farthest above the 65-day average daily volume (volume has to be greater than 50000) |
US Stocks Unfilled Gaps: |
Stocks with the largest unfilled opening gap - where the stock opens away from yesterday's close |
US Stocks Above VWAP (cents): |
Stocks whose current price is farthest above the Volume Weighted Average Price (VWAP) for the day |
US Stocks Below VWAP (cents): |
Stocks whose current price is farthest below the Volume Weighted Average Price (VWAP) for the day |
US Stocks Highest $ Put/Call Ratio: |
Stocks with the highest ratio (dollar weighted by price) of put options to call options |
US Stocks Highest $ Put/Call Ratio: |
Stocks with the lowest ratio (dollar weighted by price) of put options to call options |
US Stocks New Yearly Highs: |
Stocks making new yearly highs |
US Stocks New Yearly Lows: |
Stocks making new yearly lows |
US Stocks Weekly Pct Gainers: |
Stocks with the largest percentage gain in price in the last five trading days |
US Stocks Weekly Pct Losers: |
Stocks with the largest percentage drop in price in the last five trading days |
US Stocks Monthly Pct Gainers: |
Stocks with the largest percentage gain in price in the last month |
US Stocks Monthly Pct Losers: |
Stocks with the largest percentage drop in price in the last month |
US Stocks Quarterly Pct Gainers: |
Stocks with the largest percentage gain in price in the last three months |
US Stocks Quarterly Pct Losers: |
Stocks with the largest percentage drop in price in the last three months |
US Index Pct Gainers: |
Indexes with the largest percentage increase since yesterday's close |
US Index Pct Losers: |
Indexes with the largest percentage decrease since yesterday's close |