Overview
Many commodities and stocks trade cyclically based on historical patterns. The Seasonals study identifies patterns month over month or year over year to help find these patterns and profit from them. Seasonals are created by taking the pattern of an issue over a set period of time (usually Jan 1 of any given year to Dec 31 of the same year), and then taking that pattern and averaging it with the pattern of other years. Seasonals can be very helpful in indicating the overall historical market movement for a certain time of year.
Please note: If you are using futures data, you may need to use the continuous contract, %ES 1! for example, to have enough data to calculate the study.
How do I apply the Seasonals study?
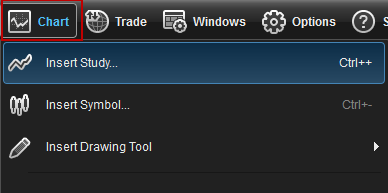
To apply this study to a chart, left-click on the Chart icon and select Insert Study from the drop-down menu.
Left-click on the Built-in Studies tab and select Seasonals.
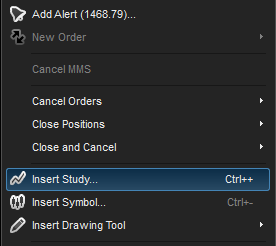
Alternatively, you can also right-click on the chart, select Insert Study, left-click on the Built-in Studies tab and select Seasonals.
The Seasonal study will then appear on the chart.
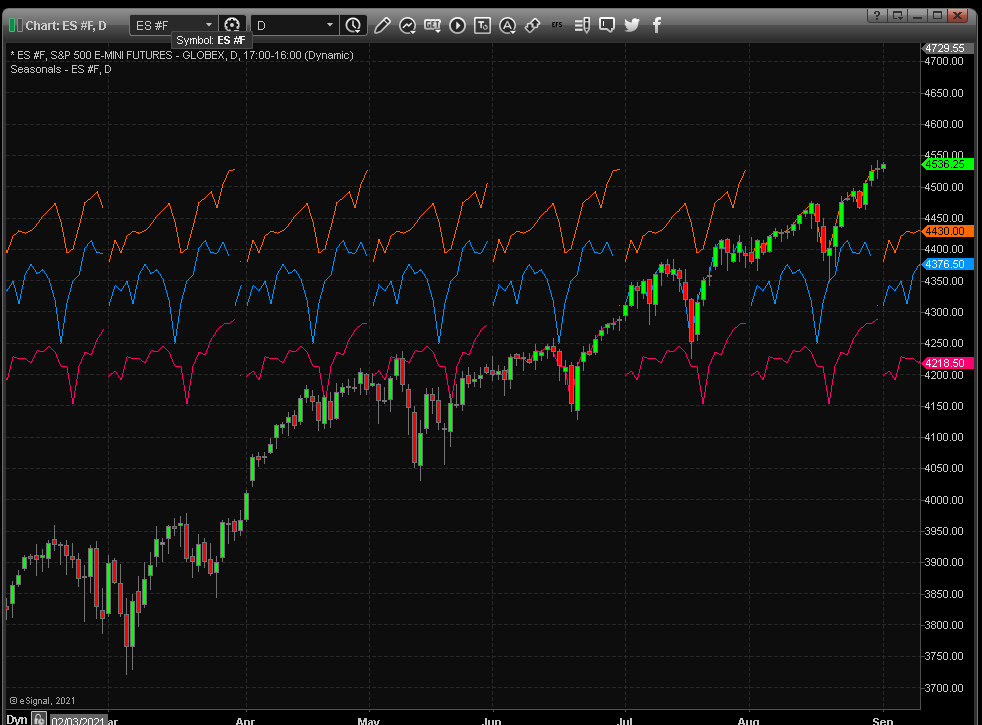
Customizing the Seasonals Study
To select the seasonal study parameters, either right-click on the chart and select Edit Chart or right-click on any of the lines of the study and select Edit.
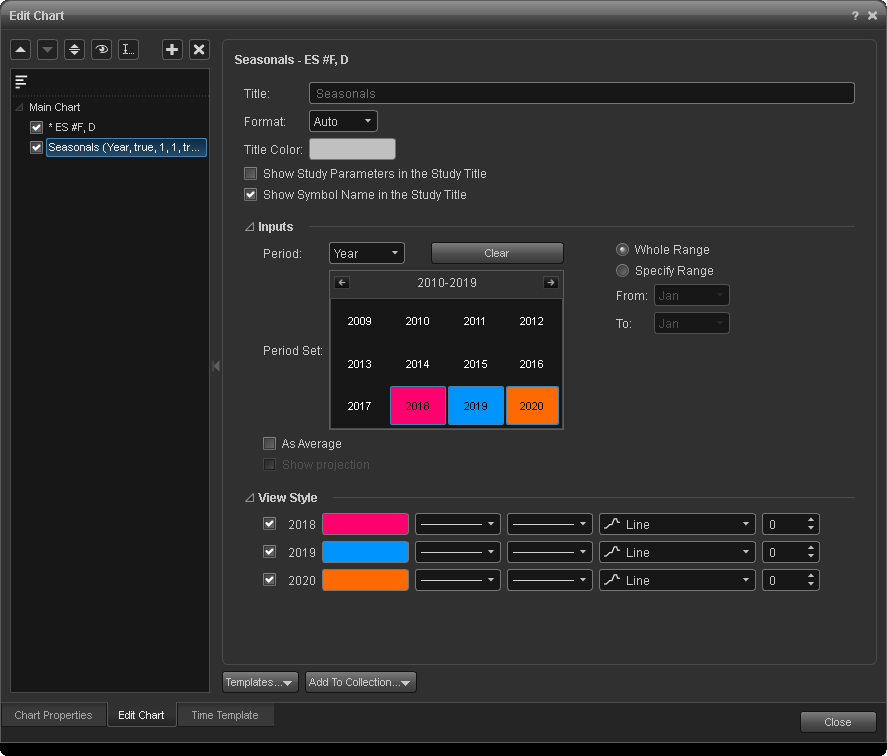
The Period input allows you to display daily, monthly, or yearly Seasonals. In the example above, we have selected the seasonal data for the years 2009, 2010, and 20011 as separate lines. You have the option to select and display the whole year or month, or a specific date range by selecting Specify Range and inputting the desired range.
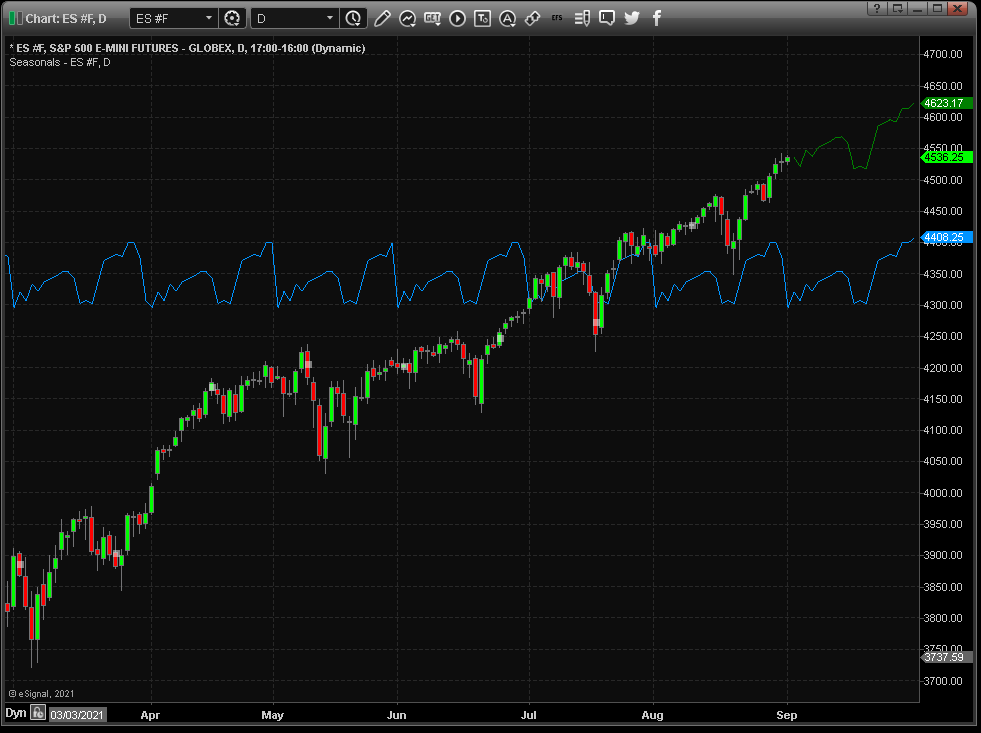
To average multiple Seasonals and display them as one blue line on the chart, select As Average.
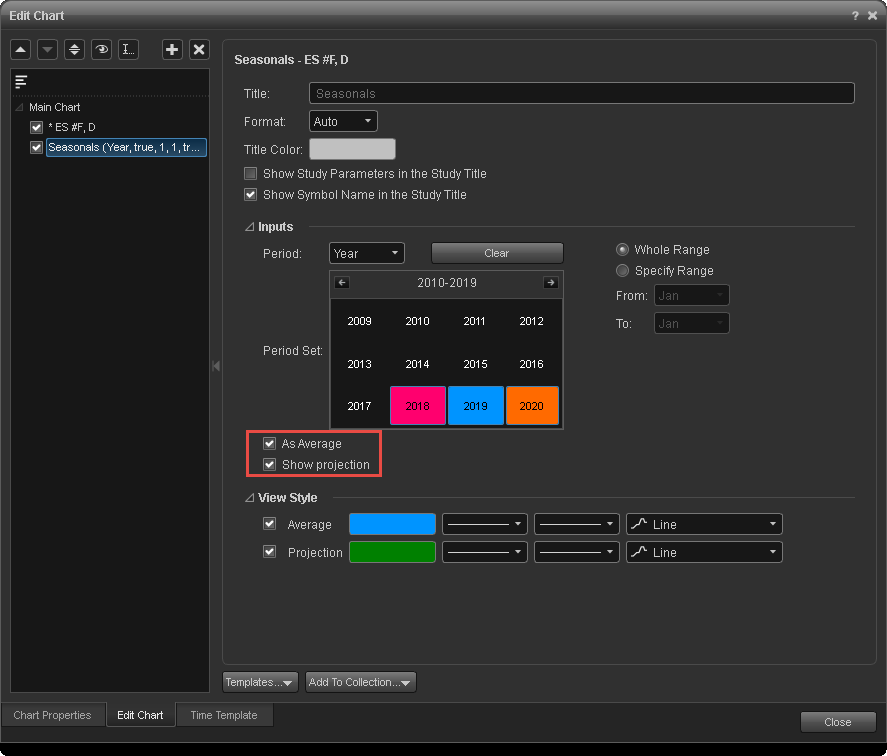
Selecting As Average will enable the Show Projection option which displays a green line extending from the current bar into the future.
Applying the Correlation Study
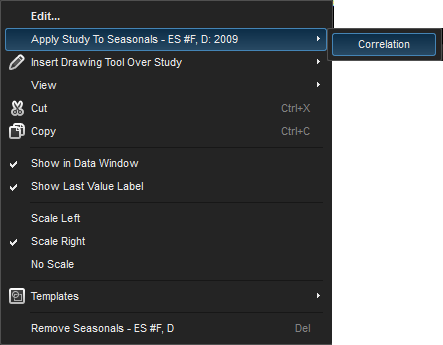
To display the degree of correlation between the issue and the Seasonals study displayed, right-click on a Seasonal line, select Apply Study to Seasonals and Correlation.
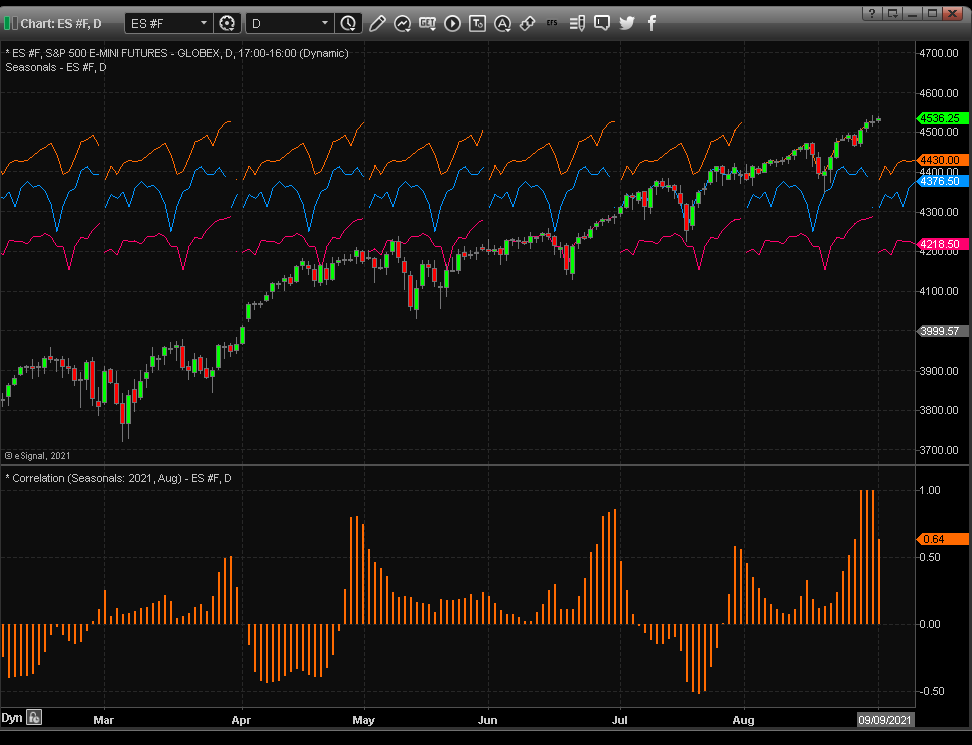
The Correlation study will then appear on the chart in the study pane.
The degree of correlation is displayed as a value between 1.00 (perfect positive correlation) and -1.00 (perfect negative correlation).
