
Kagi charts illustrate the forces of supply and demand on a security:
- A series of thick lines shows that demand is exceeding supply (a rally).
- A series of thin lines shows that supply is exceeding demand (a decline).
- Alternating thick and thin lines shows that the market is in a state of equilibrium (i.e., supply equals demand).
The most basic trading technique for Kagi charts is to buy when the Kagi line changes from thin to thick and to sell when the Kagi line changes from thick to thin.
A sequence of higher-highs and higher-lows on a Kagi chart shows the underlying forces are bullish. Whereas, lower-highs and lower-lows indicate underlying weakness.
- If today's price is greater than or equal to the starting price, then a thick line is drawn from the starting price to the new closing price.
- If today's price is less than or equal to the starting price, then a thin line is drawn from the starting price to the new closing price.
To draw subsequent lines, compare the closing price to the tip (i.e. bottom or top) of the previous Kagi line:
- If the price continued in the same direction as the previous line, the line is extended in the same direction, no matter how small the move.
- If the price moved in the opposite direction by at least the reversal amount (this may take several days), then a short horizontal line is drawn to the next column and a new vertical line is drawn to the closing price.
- If the price moved in the opposite direction of the current column by less than the reversal amount no lines are drawn.
If a thin Kagi line exceeds the prior high point on the chart, the line becomes thick. Likewise, if a thick Kagi line falls below the prior low point, the line becomes thin.
Opening a Kagi ChartTo open a Kagi Chart, select New from the menu bar and then select Chart.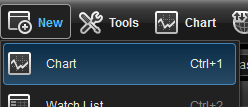 This will open a New Chart window. To change the chart type, right-click on the Chart window and select Edit Chart. Inside the Edit Chart window, select Kagi from the Chart Type dropdown menu.
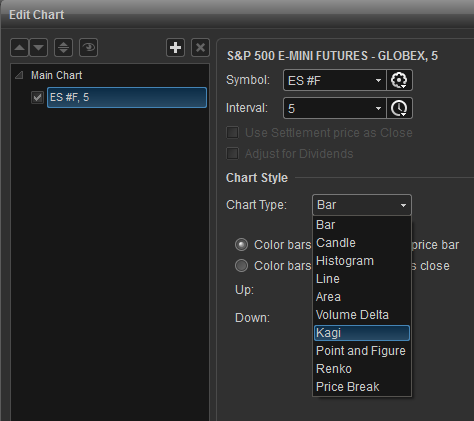
Kagi Properties
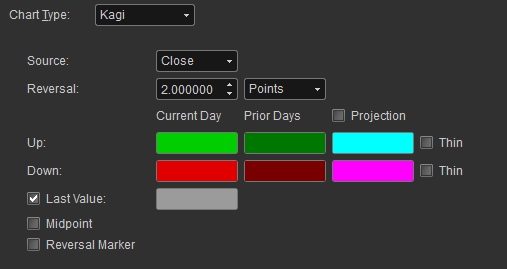
To access the Kagi properties, right-click on the chart window and select Edit Chart. Here you can set the reversal, as well as change the colors for the Kagi bars.
Reversal Points: The points method, you specify the number of points that a stock must reverse before a change in the Kagi line occurs.Reversal Percent: The Percentage method causes a reversal each time prices move more than the percentage that you specified.
Last Value: Displays the Last Price on the Chart.Midpoint: Displays the Midpoint in the Kagi Bar.Reversal Market: Display where the price has to go for a reversal to happen.