Advanced GET Drawing Tools - Make or Break (MOB)
Overview
The Make or Break (MOB) Study takes the momentum of the current swing and the previous two swings to define a price and time projection zone to anticipate major resistance in an uptrend or support in a downtrend. Approximately 70% of the time, prices will trade to the MOB projection level and reverse. The rest of the time, prices will reach the MOB price projection and continue to trade through with increasing momentum. Hence the name, "Make or Break".
The MOB has several components:

The dual colored horizontal bar is the price projection zone. If a gray square (Marker) appears in the left-hand corner of your MOB, it means there isn't enough data for the MOB to be 100% certain. Keep removing and redrawing the MOB as each bar comes in until the gray square is gone.
The MOB also has two vertically drawn Time Markers. These are two projected time periods where the software has calculated a high tendency for the prices to approach the MOB level. Prices approach the MOB levels near Time Mark #1 roughly 65% of the time and prices approach the MOB levels between Time Mark #1 and #2 roughly 35% of the time.
When the MOB is first drawn, the program calculates Time Mark #1 and Time Mark #2. As time passes by, if the prices have not taken out the pivot high or low (where the MOB was drawn from), the software will cancel the current Time Marks and recalculate new ones until the high or low is exceeded.
Please note that you must purchase Advanced GET to access this study.
How do I apply the MOB study?
To apply the MOB study on a chart, left-click on the Drawing Tools Icon, then left-click on the icon labeled MOB on the Advanced Line toolbar.

Alternatively, you can also right-click on the chart, when the menu appears, highlight Insert Drawing Tools, left-click on MOB. A keyboard shortcut (Alt +M) is also available.

After selecting the MOB study, the mouse cursor will be labeled MOB.
The simplest way to originate the MOB calculations is to draw them from a previous pivot (Primary or Major). The Pivots can be calculated and displayed by selecting the GET Pivots study on the Advance Get Studies menu.

When the MOB is used with the Elliot Waves study, MOB Projection zones usually provide the termination point for a Five Wave Elliott sequence. Left-click on the bar labeled Wave 3.

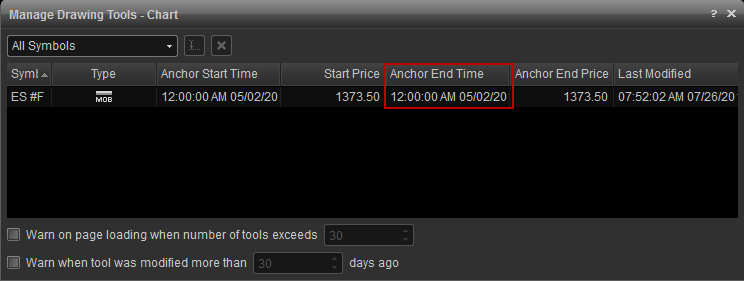
If you placed a MOB on a chart and cannot remember what bar used to draw it from, right-click on the chart and select Drawing Tools Manager. Find the Anchor End Time for the relevant MOB.

Properties
To change the properties of the MOB, right-click put your cursor on top of the MOB, right-click and select Edit. This will open the Edit Chart dialog box. Select MOB.

Zone 1 & 2: Colors selection list allows you to change the color of each of the MOB zones.
Marker: Colors selection list allows you to change the color of the Marker.
Alerts
Select the Alerts tab to set alert parameters.

Enable Price Alert: Triggers an alert when price crosses the upper or lower boundary of the MOB.
Enable End of MOB Time Alert: Triggers an alert when a new price bar appears beyond the right-side boundary of the MOB.
Enable Fib Marks Alert: Triggers an alert when price crosses the MOB between the Time Markers.
Alert Action: Select for when an alert triggers, to get a pop up alert, an audio alert, and if configured, an e-mail alert message.
Removing a MOB
(1) Right-click on the MOB you want to remove. When the MOB menu appears, left-click on Remove MOB.
(2) Left-click on the MOB and press the Delete key.
(3) Right-click on the chart and left click on the Edit Chart. Highlight the MOB to be removed and click on the X icon.