Advanced GET Drawing Tools - Time and Price Squares
Overview
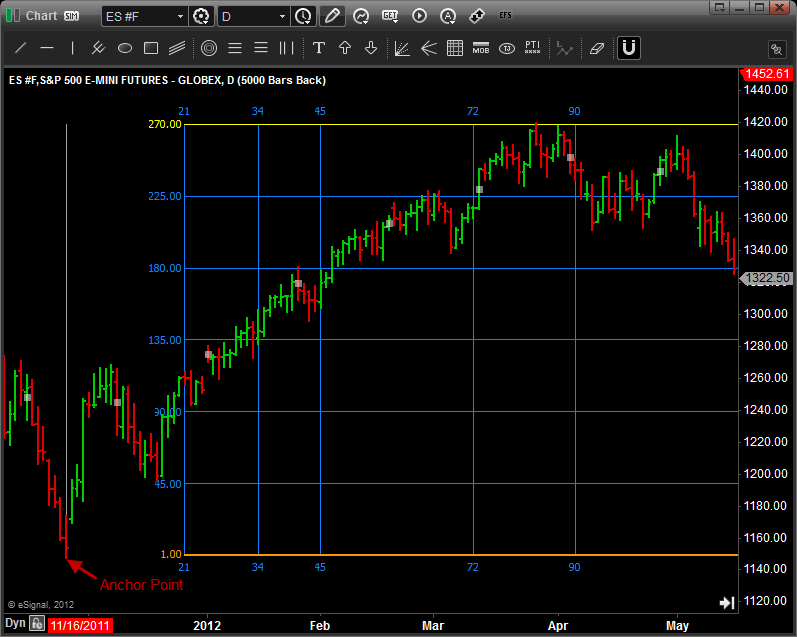
Time & Price Squares are used to show the relationship of time periods (X-axis) versus prices (Y-axis) to help to identify changes in a trend, such as those found at the end of an Elliott Wave Three, Four or Five, or in A-B-C corrections as well as intermediate and minor price swings. Time & Price Squares in Advanced GET are values determined by Gann (Time) & Fibonacci (Price).
The theory is markets tend to change trends at certain numbers from a Major high or low. As a general rule, use a primary pivot (a significant high or low point), as a starting point for your Time & Price Squares calculation. However, take the time to experiment with other pivots to see how this can enhance the use of this tool. Our studies have concluded that a combination of both Fibonacci and Gann can increase odds of picking up turning points. The time sequences have been tested out for all markets and time frames. In addition, our testing shows trading days to be more consistent than calendar days.
Markets can also use the price sequence as support and resistance levels. When the market trades into both a time and price sequence, this is called a Time & Price Square area.
Markets can also use the price sequence as support and resistance levels. When the market trades into both a time and price sequence, this is called a Time & Price Square area.
How do I apply the Time & Price Squares study?
To apply the Time & Price Squares study on a chart, left-click on the Drawing Tools Icon, then left-click on the icon labeled Time & Price Squares on the Advanced Line toolbar.
To apply the Time & Price Squares study on a chart, left-click on the Drawing Tools Icon, then left-click on the icon labeled Time & Price Squares on the Advanced Line toolbar.

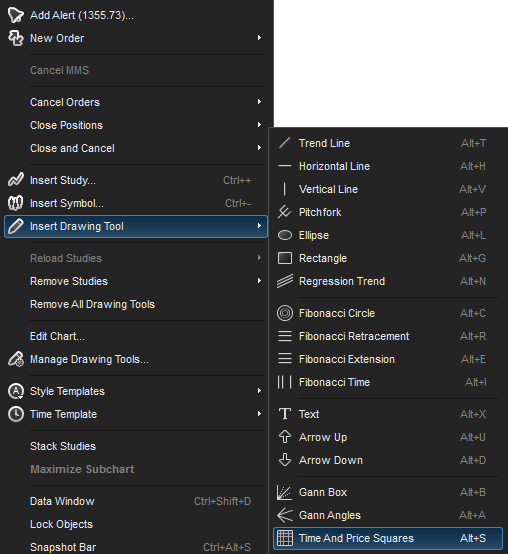
alternatively, you can also right-click on the chart, when the menu appears, highlight insert drawing tools, left-click on time & price squares. a keyboard shortcut (alt +s) is also available.

After selecting the Time & Price Squares study, the mouse cursor will be labeled Time & Price Squares. Position the cursor at the bar that you wish to start on (usually a high or a low) and left-click. This will show a Time & Price Squares grid. As you move the mouse up and down, left and right, you will note that the periods or prices will show up only in the areas where the mouse has not been. Left-click to make the Time & Price Squares grid stay on the chart.

Properties
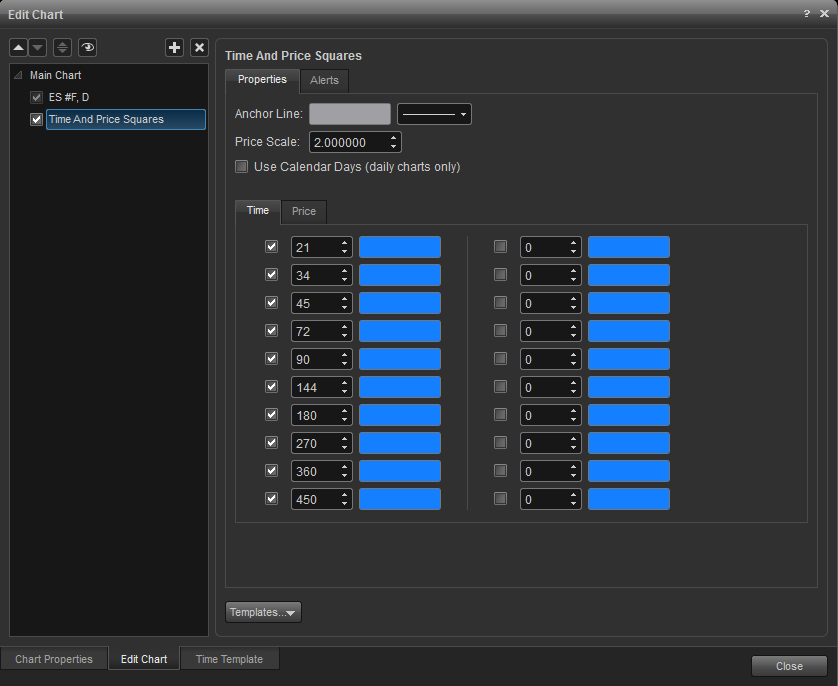
To edit the Time & Price Squares study parameters, either right-click on the chart and select Edit Chart or right-click on any of the lines of the study and select Edit.

Anchor Line: Select the color for the anchor line (starting point).
Price Scale: Sets the price scaling for display of of the Time & Price Square. Experiment with this parameter to find the "best fit".
Calendar: When checked, the Time & Price Squares will use calendar days instead of trading days on a daily chart for the times indicated under the Times column.
Price Scale: Sets the price scaling for display of of the Time & Price Square. Experiment with this parameter to find the "best fit".
Calendar: When checked, the Time & Price Squares will use calendar days instead of trading days on a daily chart for the times indicated under the Times column.
Time Tab: Select the values based on time to be displayed as the vertical lines of the Time & Price Squares.
Price Tab:
Alerts
Select the Alerts tab to set an alert for when price is within a selected range of a price line or if a bar is with a vertical time line.

Enable Alert
Alert Area: Select the minimum of number ticks that price has to be within the range of a study line or set it "0" if the price must cross the study line to trigger an alert.
Once per Bar: When checked, the alert will not trigger again until the price bar forms.
Alert Action: Select for when an alert triggers, to get a pop up alert, an audio alert, and if configured, an e-mail alert message
Enable Alert on Vertical Lines
Alert Area: Select the minimum of number bars that has to be within the range of a study line or set it "0" if the price must cross the study line to trigger an alert.
Alert Action:
Removing Time & Price Squares
(1) Right-click on the Time & Price Squares you want to remove. When the Time & Price Squares menu appears, left-click on Remove Time & Price Squares.
(1) Right-click on the Time & Price Squares you want to remove. When the Time & Price Squares menu appears, left-click on Remove Time & Price Squares.
(2) Left-click on the Time & Price Squares and press the Delete key.
(3) Right-click on the chart and left click on Edit Chart. Highlight Time & Price Squares to be removed and click on the X icon.