Overview
The PTI (Profit-Taking Index) is an algorithm developed in Advanced GET that is quantifiable and attempts to define the buying or selling momentum at different stages of development to distinguish between normal and abnormal profit-taking.
The PTI uses a scale from 0 to 100. If the PTI is greater than 35 it is said to have "normal profit-taking" and the market statistically exhibits a greater tendency to initiate a fifth wave or a second attempt phase. If the PTI is less than 35 it is said to "not have normal profit-taking" and the market generally fails to initiate a fifth wave or second attempt phase. The PTI numerical value has the same interpretation no matter which direction the price pattern is trending.
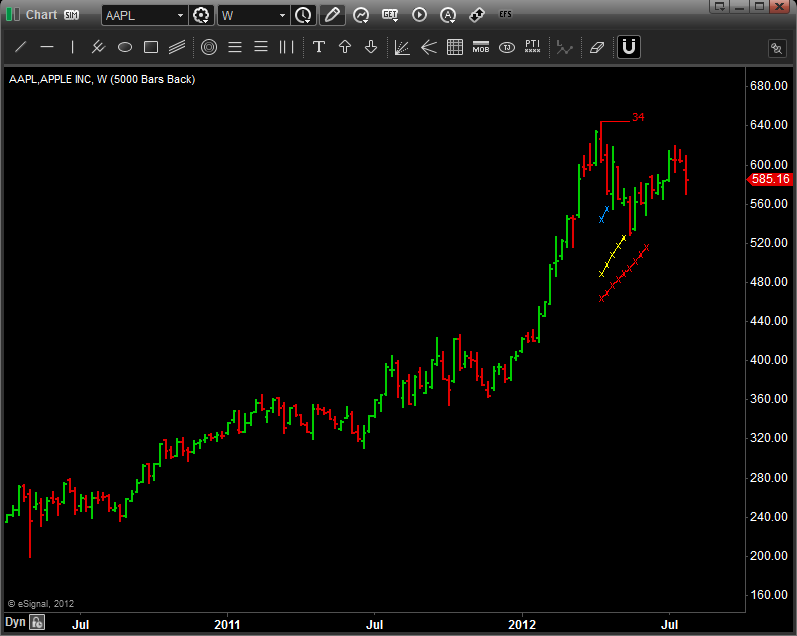
When the GET Elliott Waves study is applied to a chart, the PTI and Wave 4 Channels are automatically generated after Wave 3 is completed are part of the criteria for a Type One Trade. The PTI drawing tool is used to manually draw a PTI (Profit Taking Index) and the Wave 4 Channels.
To get a PTI that is similar to a PTI automatically generated by Elliott Waves, you must move the PTI cursor to the point you believe is the end of Wave 2 and click your left mouse button. Next, move your mouse cursor to the point where you believe Wave 3 has ended and press your left mouse button for a second time. Lastly, move the PTI cursor to the last bar in what you believe is the Wave 4 and press your left mouse button for the third time to place the PTI and Wave 4 channels on the chart. Please note that the PTI value will not automatically adjust as new bars are placed on the chart - you must redraw the PTI as the Wave 4 progresses.
Please note that you must have an Elite subscription to access this study.
How Do I Manually Apply the PTI?
To manually apply the PTI on a chart, left-click on the Drawing Tools icon, then left-click on the icon labeled PTI on the Advanced Line toolbar.
To manually apply the PTI on a chart, left-click on the Drawing Tools icon, then left-click on the icon labeled PTI on the Advanced Line toolbar.

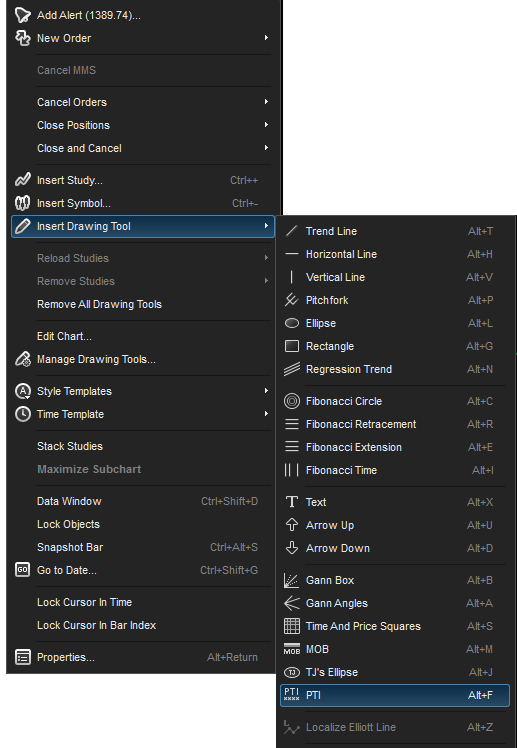
Alternatively, you can also right-click on the chart, when the menu appears, highlight Insert Drawing Tools, left-click on the Advanced GET tab and then select PTI. A keyboard shortcut (Alt + F) is also available.

Applying the PTI is a two click process. Select a low then a high pivot point if in an uptrend. Or, select a high then a low pivot point if in a downtrend. The PTI and Wave 4 Channel lines will appear on the chart.

Properties
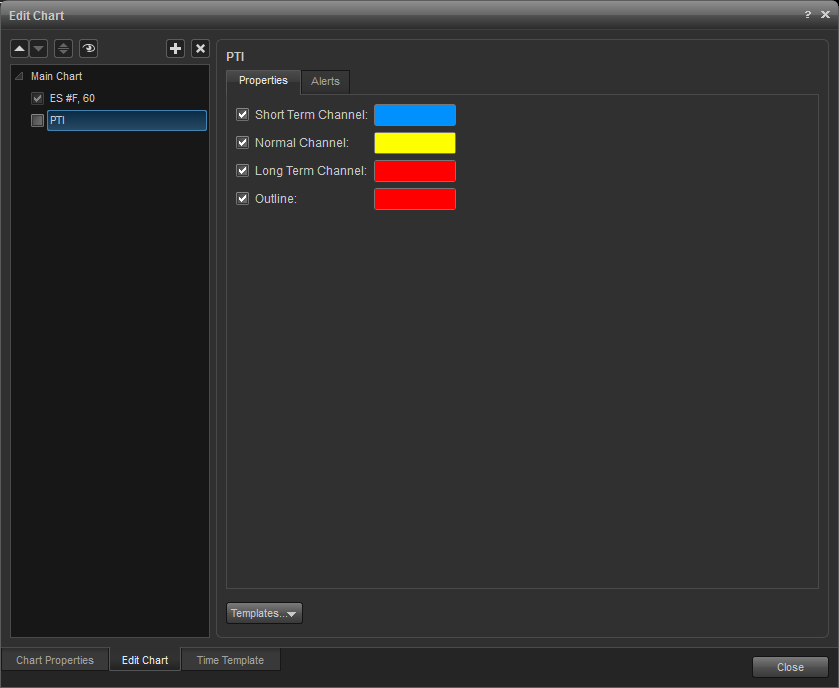
To edit the PTI study parameters whether to be applied and to select the colors of study , either right-click on the chart and select Edit Chart or right-click on the study and select Edit.

Alerts
Select the Alerts tab to set an alert for when price exceeds price or time parameter.

Enable Price Alert: When checked, an alert will be triggered when price reaches a channel line.
Enable Time Alert: When checked, an alert will be triggered when price goes beyond the right-hand boundary of a channel line.
Auto Reactivate: When checked, the alert will reactivate so it can be triggered again.
Once per Bar: When checked, the alert will not trigger again until the price bar forms.
Alert Action: Select for when an alert triggers, to get a pop up alert, an audio alert, and if configured, an e-mail alert message.
Once per Bar: When checked, the alert will not trigger again until the price bar forms.
Alert Action: Select for when an alert triggers, to get a pop up alert, an audio alert, and if configured, an e-mail alert message.
Removing the PTI
(1) Right-click on the PTI you want to remove. When the Gann Angles study menu appears, left-click on Remove PTI.
(1) Right-click on the PTI you want to remove. When the Gann Angles study menu appears, left-click on Remove PTI.
(2) Left-click on the PTI and press the Delete key.
(3) Right-click on the chart and left click on Edit Chart. Highlight the PTI to be removed and click on the X icon.