stock splits and dividends
our qa department gets a daily list of upcoming splits and adjustments and will manually adjust the history data (daily data) as close to the effective date as possible. if a day or two passes and it appears we have missed a split or adjustment, please submit the missing stock splits via our report a questionable price. in general, we do not adjust for dividends. the exception is a high profile and/or significant dividend like the $3 payout microsoft issued sometime back.
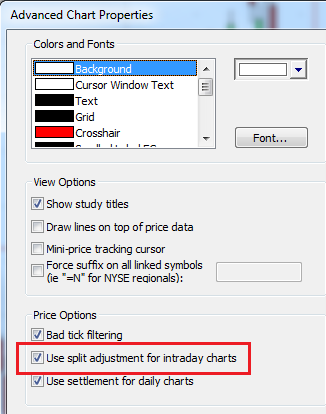
stock splits are not considered bad ticks but can be reported via the report a questionable price. we are able to adjust splits on our history charts (daily, weekly, monthly) at the network level. with the release of esignal 10.2, the ability to adjust for intraday splits is now available at the desktop level. to adjust for splits on the advanced chart, right click the chart and select properties. add a checkmark next to 'use split adjustments for intraday charts'. please note that this will only work after the daily chart has been adjusted for the split. you may need to restart esignal for this feature to take effect. if the split adjustment still does not show up after restarting, you may need to delete the corpacts.tab file located in the esignal and sigtext directories (c:\program files\esignal and c:\program files\esignal\sigtext).

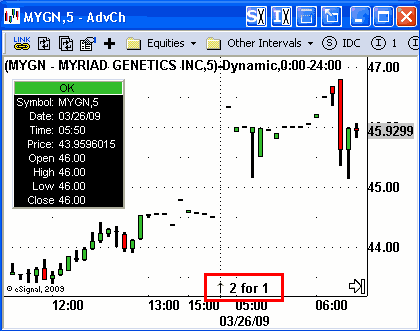
the adjustment for the split will automatically be applied to the chart along with the split ratio (2 to 1 split in the example below):

use settlement for daily charts
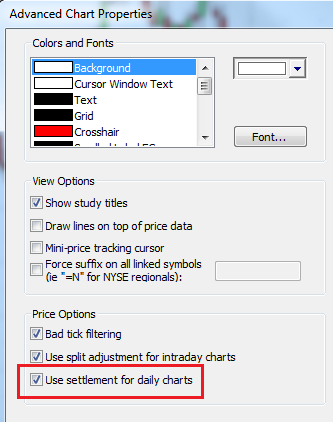
for daily charts, esignal allows you to view either the settlement price or the last trade as the close. right click the chart and select properties to access the menu below. add a checkmark next to use settlement for daily charts if you prefer to view the settlement price or leave this setting unchecked to view the last price. please note that this feature only affects symbols that have large trading periods after the settle is released such as the dax, gold, and silver futures. currently intraday charts don't have the option of toggling the settlement price on. we're hopeful this will be available with our esignal 11.4 release due in q1 2012.
pe ratio
the pe ratio is fundamental data that we get from a third party once a night based on the data up through that day. pe or, price/earnings, ratio should change as the price changes. the pe ratio is calculated by taking the last price and dividing by ernings per share (eps). the earnings figures are based on the last 12 months of available data (also known as ttm - trailing 12 months).
if you are using excel, it will not update dynamically. esignal calculates the pe ratio on the fly at the desktop level as the price changes. the pe ratio that you see in excel is a static figure received from the data manager. this static figure is updated every evening.
if you would like to have excel calculate the pe on the fly like esignal does, all you need to do is setup a column that takes the last price and divides it by the eps.
is the total volume figure on stocks actual or rounded?
in the vast majority of cases, the cumulative volume for equities is an actual figure and no rounding will occur. exceptions occur when a stock's trading volume exceeds 16.77 million shares in a given trading day (this is due to the binary coding used in our data packets). once the trading volume exceeds 16.77m, we divide by a factor of 10 and round up. if it were to exceed 167.7m, we'd divide by 100.
eSignal Tip: The Total Volume column a quote window can display in either short or long format (ex. 1.58m vs 1575269).
To change the setting, right-click on the Volume ( or Vol ) column, select Data, then choose either Long or Short.
How does eSignal calculate Dividend Yield?
To calculate Dividend Yield we take the Dividend value, coupled with the Dividend Interval and the last price to calculate the Dividend Yield.
Average Volume
eSignal looks at the total daily volume for each stock and averages the last 20 trading days to get the Average Volume. This figure is then updated once each day to reflect yesterday's total volume.
To add the Average Volume to your quote/summary window, do the following:
1. Right click on the heading (for example, the Last column)
2. Left click on Add Field
4. Select Average Volume
5. Click OK
Fixed Income Data
eSignal offers fixed income data from GovPx. For a list of symbols available with GovPx US Benchmark Treasuries, click here. For other fixed income offerings, please visit our Pricing Guide.
View Regional Quotes
All standard NYSE and AMEX symbols are composite symbols, meaning the trading data from all regional exchanges is included in the high/low/volume figures and in Time and Sales. To see data for specific region, there are several methods to view/analyze.
1. The first way is to right click on a NYSE or AMEX issue and choose Market Depth. This will display all the regional data available for that symbol.
2. The second way is to right click on a NYSE or AMEX issue and choose Autolist. This will list all the individual exchange-resident symbols and the data for each. For NASDAQ symbols, click Quote Options>Insert AutoList/Option Chain, select Regionals and click OK.
3. The third method is to enter the specific exchange-resident symbol manually. Type the symbol then an equals (=) sign followed by the single letter designate for that exchange. For example, to see only NYSE trades on IBM, you'd enter IBM=N. For trades from Boston only, you'd type IBM=B.
We are storing the regional data on our intraday history servers so you can pull-up a 5 or 10 minute chart for a specific region (i.e. IBM=N). However, due to the amount of data in question, we are NOT storing this regional data on our daily history servers. As a result, if you enter IBM=N on a daily chart, the symbol will automatically be changed to IBM.
Here is a list of all US Equity and Option Exchanges, their symbols and abreviations.
A = AMEX American Stock Exchange
B = BSE/BOX Boston Stock and Options Exchange
C = CSE Cincinnati Stock Exchange
I = ISE International Securities Exchange
M = MSE Midwest (Chicago) Stock Exchange
N = NYSE New York Stock Exchange
O = NASD National Association of Securities Dealers
P = PSE/PCX Pacific Exchange - Stock and Options (Acquired by Archipelago- 01/05)
Q = NMS National Market Service (NASDAQ)
T = THRD Third Party (listed stocks on the OTC market)
W=CBOE Chicago Board of Options Exchange
X = PHIL Philadelphia Stock and Options Exchange
What does the plus(+) or minus(-) sign next to the bid price mean?
The + or - sign is a requirement for NASD issues to signify whether the previous bid price was lower or higher than the current. Here's the exact definition per NASD:
Bid Tick Indicator-The Bid Tick Indicator is only required for real-time quotations of Nasdaq National Market securities. As a service to investors and market participants, market data distributors are required to show the bid tick indicator wherever the Inside Bid for a Nasdaq National Market issue is displayed (whether on a individual quotations or a market minder screen). The Bid Tick Indicator is commonly displayed as up/down arrow next to the Bid. Under NASD Rule 3350, NASD member firms may be prohibited from effecting short sales at or below the current inside bid, as disseminated by The Nasdaq Stock Market, whenever the bid is lower than the previous inside bid.
For more information please click here.
Time & Sales Sizes
In a time and sales window for stocks, next to bid/ask updates, you list sizes like 10x10 or 100x15. What do those numbers represent?
Whether you are looking in a time and sales window, a quote window or in a Nasdaq Level 2 window, all bid and ask sizes represent 1/100 of their actual value. To make it simpler, just multiply any bid size or ask size by 100 to get the actual value. For ex, a listing of 100x15, means there are 10,000 shares available on the bid and 1500 on the ask.
Stocks not listed in fundamental data
Certain stocks are not included in our fundamental data. These are preferred, when-issued, units, closed-end funds, and some class stocks. A class stock will only be included if it's the most active stock issued by a company. The name of a stock that is included in our data is pulled from this fundamental data. If the name shows the generic "U.S. Stocks", then that means it's probably not included in the fundamental data.
Missing 52 week Hi/Lo in detail window
This is common when a company has 2 or more issues. We typically only receive fundamental data on one of the two (usually the most active one).
What are the Nasdaq 100 Pre- and Post-Market indicators?
These are indicators based on the Nasdaq-100 Index ($NDX). They are designed to track the top Nasdaq issues during the extended trading hours sessions.
$QMI Nasdaq 100 Pre-Market Indicator
$QIV Nasdaq 100 After Hours Indicator
Who calculates the data for these symbols?
All data vendors are required to calculate these symbols themselves.
What is the formula for calculating the Nasdaq 100 Pre- and Post-Market indicators?
Please visit NasdaqTrader.com for this information.
What times are these indices available?
Pre-Market Indicator will be available online from 8:30 a.m. - 9:30 a.m., Eastern Time (ET). It is important to note that the closing value for the Nasdaq-100 Index is not final until 5:15 p.m., Eastern Time (ET), and as a result the closing value may change between 4:15 and 5:15 p.m., ET.
After-hours NASDAQ Trading
The after hours trades on that can occur between 7:00am - 8:00am and 6:30pm and 8:00pm ET are transacted entirely within the ECN systems. This means that they do not send these trades through the NASDAQ feed, and thus are not sent. Furthermore, the individual feeds we recieve from ECN's contain only Market Depth information (no trade data.) At this time, we are not able to receive the trades that occur during the aforementioned after hour periods.