Overview
The GET XTL (eXpert Trend Locator) is a study Tom Joseph developed that uses a statistical evaluation of the market to tell the difference between random market swings (noise) and directed market swings (trends). It works on all markets and for any time frame without any modification.
The GET XTL is a simple but powerful tool. If the bars are blue in color, then the trend is up. If the bars are red in color, then the trend is down. If the bars are gray in color, the trend is neither up nor down or in other words, the market is in a non-trending or "noisy" mode.
How do I apply the GET XTL study?
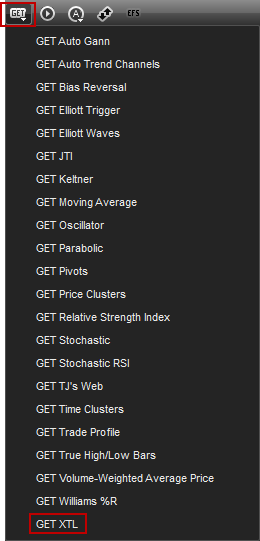
To apply the GET XTL study to a chart, left-click on the GET icon and select GET XTL from the drop-down menu.

Alternatively, you can also right-click on the chart, when the menu appears, left-click on Insert Study, left-click on the Advanced Get tab and then select GET XTL .

The GET XTL study will then appear in the chart window.

Properties
To edit the GET XTL study parameters, either right-click on the chart and select Edit Chart or right-click on any of the bars and select Edit.

Period: Indicates the number of bars used to calculate the GET XTL. The default is 35.
Coloring: Up, Down, and Neutral Color selection list allows you to choose the color in which the trending and non-trending bars will be displayed.
Alerts
Select the Alerts tab to set an alert for when the GET XTL changes color.

Auto Reactivate: When checked, the alert will reactivate so it can be triggered again.
Once per Bar: When checked, the alert will not trigger again until the price bar forms.
Alert Action: Select for when an alert triggers, to get a pop up alert, an audio alert, and if configured, an e-mail alert message.
Once per Bar: When checked, the alert will not trigger again until the price bar forms.
Alert Action: Select for when an alert triggers, to get a pop up alert, an audio alert, and if configured, an e-mail alert message.