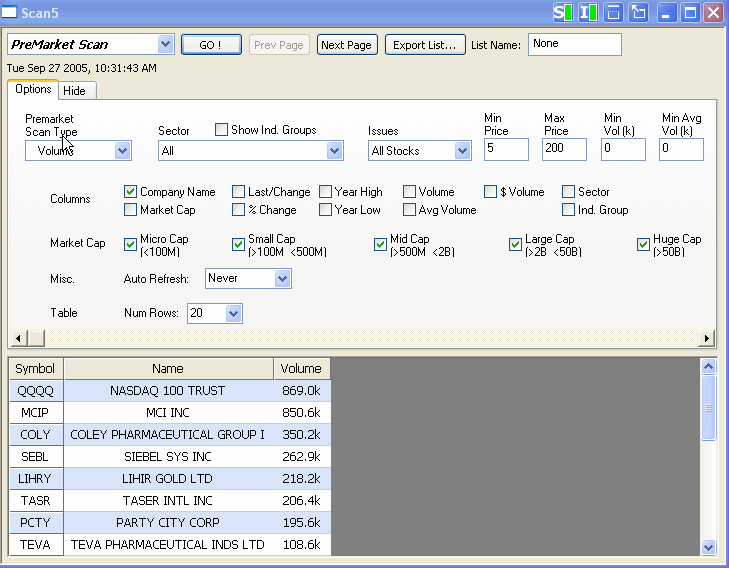
How to add the Pre-Market Scanner to your Services:
The Pre-Market Scan is included in both the Power and Turbo packages. Both packages require subscription. For Pre-Market Data for NASDAQ, you must add the NASDAQ exchange to your services..
The Pre-Market Scanner can be open within eSignal by clicking on File > New > Scan from the main menu bar. 
Selecting Pre-Market Scan in the upper left hand corner of the Scan window. 
Automatic or Manual Updates
 |
To manually trigger a new search, simply hit the GO button. To have the search results refreshed automatically, locate the Auto Refresh option and change from Never to either every 2, 5, 10 or 15 minutes. You'll see the timer to the right to immediately begin counting down to the next refresh.
Pre-Market Scan Type
Volume Highest volume traded that day
Dollar Volume Highest dollar volume (volume x share price) that day
% Gainers Highest % appreciation that day
% Losers Highest % depreciation that day
$ Gainers Highest dollar appreciation that day
$ Losers Highest dollar depreciation that day
Sector - Allows you to view belonging to certain sectors or industry groups.
Show Ind. Groups - Displays/turns off the industry groups listing
Issues
ALL All Stocks
IPO(<2 Wks) Stocks that have IPO'd within the last 2 weeks
IPO(2 Wks - 3 Mos) Stocks that have IPO'd between 2 weeks and 3 months ago
IPO(3 Mos - Year) Stocks that have IPO'd between 3 months and 1 year ago
Min/Max Price - Allows you to set price brackets (ie., minimum/maximum dollar value per share) to focus on stocks best suited to your trading needs.
Min/Avg Volume - The Min Volume is used to select stocks whose pre-market trade volume exceeds the specified value. For example: If Min Volume is set to 100k, this means a stock has to trade over 100,000 shares since the market closed on the previous day to be included in the scan.
The Avg Volume is used to select stocks whose last 20 day average volume exceeds the specified value. For example: If Avg Volume is set to 2000k, this means a stock has to trade over 2,000,000 shares average per day over the last 20 days to be included in the scan. Helpful for weeding out very thinly traded stocks whose movements are not supported by sufficient volume for trading.
Columns - Allows you to select additional information to be displayed for each issue which meets your criteria.
Market Cap - Allows you to eliminate stocks whose market capitalization are outside the specified boundaries.
Table - Allows you to set the number of issues that are displayed at one time. If you are seeing too few results you may want to change your search criteria. If you have a full page of results and want to have more displayed on each page, you can choose the number of rows from the drop down list in the table section at the bottom of the scanner page.
Options:
Saved Scans - Allows you to save all your current settings and restore them later. You may have up to 10 saved scans.
Load - Loads the selected saved scan
Delete - Deletes the selected saved scan
Save As - Saves all your current settings under a name that the user enters.
Scanner Instructions and Descriptions
For complete descriptions of each field in the Market Scanners, click on the HELP button located in the Browser Version on each Scanner page, or visit this KB article.
Use eSignal Market Scanner to spot trading opportunities
eSignal 10.6 's real time market scanner searches the entire market in a matter of seconds based on the criteria you entered. The scanner lets you access critical price performance data as soon as the markets are open. Every time you run the scanner, you get a concise, easy-to-read list of stocks that are trading candidates. And, the list is based on the latest real time streaming market data!
*Please note that the scanner only scans the market for US stocks.