This article provides an overview for using Chart Studies in eSignal. For Chart Window Basics, click here. Chart studies are based on the EFS scripting language. Click here for more information on EFS.
Insert Study on Secondary Symbol
Edit Study
Alerts on Studies
Applying a Study to a Study
Remove study
Stack Studies
Maximize Study
Create Study Template
Displaying Studies In Front of Candles or Bars
Insert Study
To insert a study on a chart, right-click in the chart window and select Insert Study:
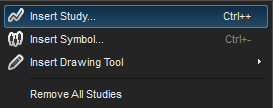
This will give you access to the Insert Study window.

A shortcut to add a Built-In Study is to click the Built-In Studies icon
After adding a study, it will appear either on the price chart or in subchart window below it:

Inserting a study on a secondary symbol
To insert a study for a secondary symbol on chart, right click inside of the chart window and select Insert Study. From the Insert Study window select the study you wish to add and then select the symbol you wish to add the study to in the Study on drop down box at the bottom of the window. (Image below)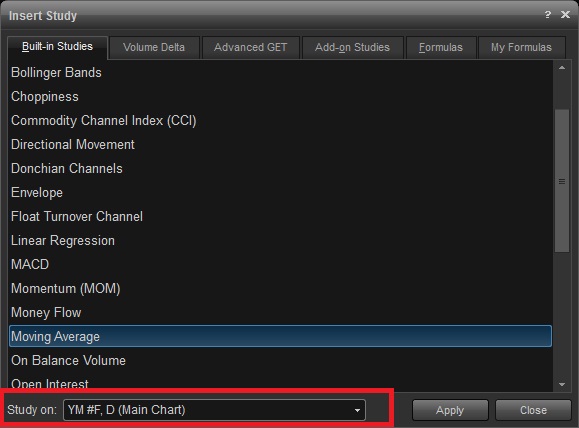
Edit a Study
To edit a study, right-click on the chart then select Edit Chart. Alternatively, you can access the edit chart menu by double left-clicking over the study on the chart. In the edit chart window, highlight the study in the left panel to make changes.
In the top left corner there are four icons and in the upper right hand corner, there are five icons and two tabs in the section to the right.
The first two icons are the Move Item Up  and Move Item Down
  icons. These can be used to resort the order in which the studies appear.
 icon, This button will allow you to unmerge studies.
  icon. This button toggles the display of the study on the chart on or off. (Hide/Unhide)
 icon. This button allows you to rename the item selected on the left side of the window.
  icon. This button will display the Insert Study dialog box so you can select a study to add to the chart.
  icon, which will remove the selected study from the chart.
The Properties tab in the next section to the right allows you to edit parameters and the style of the study. the options available to edit will depend on the parameters of the particular study. the alerts tab enables to set an alert on the study.
Alerts
You can add and alert to a built-in study or an advanced get study on the chart by right-clicking in the chart window and selecting Edit Chart. Click on the Alerts tab and highlight the study you want to place the alert on. the components of the alerts menu will vary from study to study as it's based on what's available from the properties tab. In this example, the Relative Strength Index is selected:
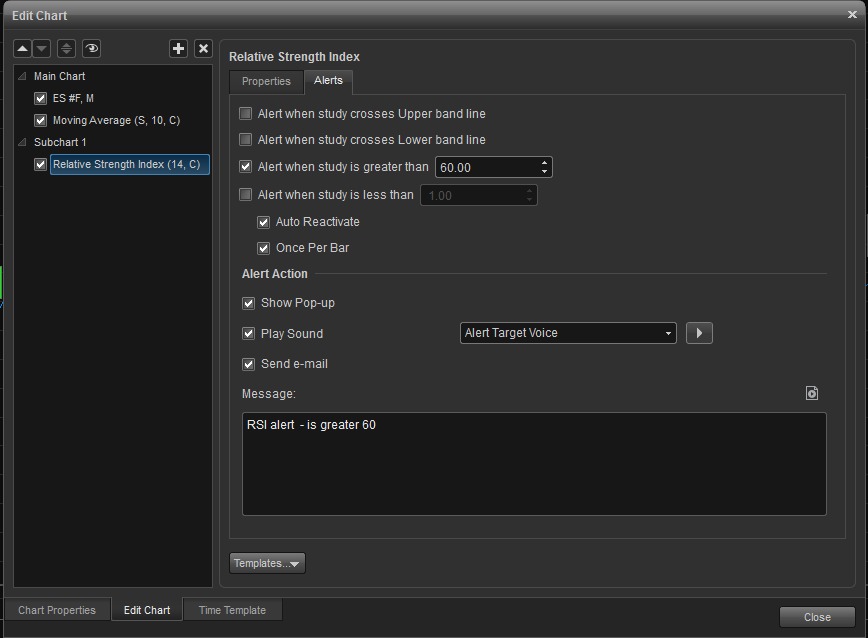
You can select the specific alert parameter(s), how you want to be alerted (i.e. Pop-Up, Play Sound, E-mail), and create a customized message for the alert notification.
The are several methods to remove a study from the chart. The first method is to right or left-click the on the study then press the Delete key on your keyboard. Second, you can right-click on the study which will bring up the Remove option on the menu and select it. The third method is to remove it from the Edit Chart window and select and click the Remove icon.
Remove all the studies from the chart by right-clicking in the chart window and select Remove All Studies.
You can merge two or more studies, as well as overlay studies over the bars in the chart, sharing a common scale in order to display properly. To perform this, single left click on the study you want to merge. After you single click on the study you will see little squares added to the study. Place your mouse cursor over one of those squares, hold down your left mouse button, then drag your mouse cursor on top another study and then release the left mouse button.
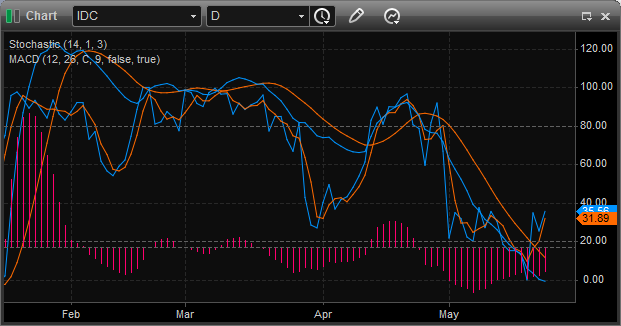
To Unmerge the studies, right-click the mouse inside the chart and select Edit Chart. It will open the edit chart window and on the left-hand side you will see the list of studies. Highlight the study that you will like to unmerge and click the 'Unmerge Item" icon.

Stack Studies
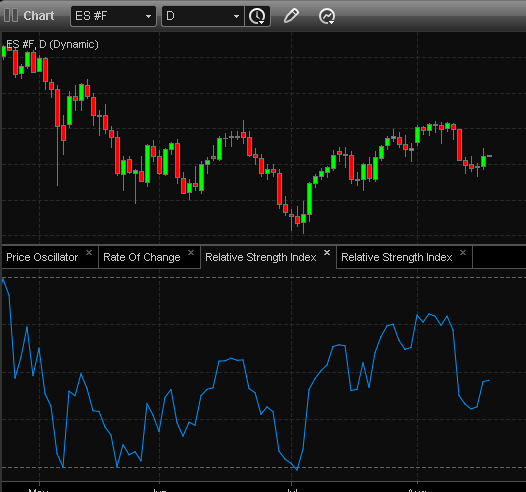
When you add indicators such as MACD and Stochastic to the chart, they will display in a separate pane below the chart. The Stack Studies feature allows you to view the studies one at a time in a tabbed format as shown below. Right-click the chart and select Stack Studies to toggle this feature on or off.
Maximize Study
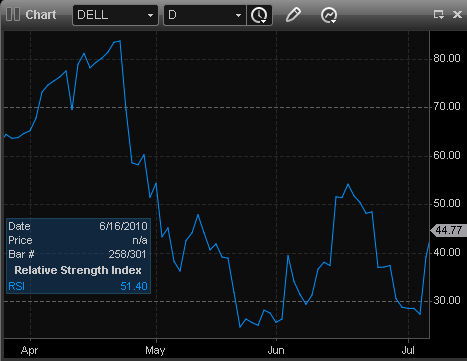
A study that appears in a separate pane below the price bars (RSI, Volume, Price Osc., Etc) can be maximized. Once maximized, the study is displayed in the entire chart with the price bars hidden. Double left-click the study pane (anywhere other than the study itself) to maximize or restore the study. The study can also be maximized by right-clicking in the Chart window and selecting Maximize Subchart. The price chart and study window can be restored to their previous display by right-clicking in the chart window and selecting Restore Subchart.
Right-click Menu
Right-clicking on the line of a study will display this menu:
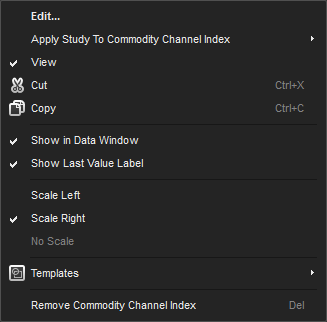
Edit: Displays the Edit Chart dialog box.
Applying a Study to a Study
To learn how to Apply a Study of a Study please go here.
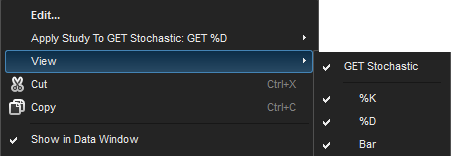
View: This allows you to hide or unhide different settings for the study selected.
Cut: Allows you to cut and paste a study from to another subchart or to the price chart on the same page or a different page.
Copy: Allows you to copy a study from to another subchart or to the price chart on the same page or a different page.
Show in Data Window: Toggles on and off the display of the study value in the data window.
Show last Value Label: Toggles on and off the display of the study value in the scale.
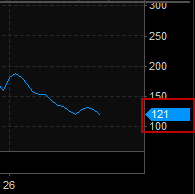
Scale Left: Displays study's values on the left side of the study window.
Scale Right: Displays study's values on the left side of the study window.
No Scale: Is selectable if you have applied a study to study or overlaid a study on another and the scale becomes skewed, then selecting no scale will normalize it.
Templates: Allows you to create templates for studies that you have customized. Right click the study and select Save Template as. Specify the name you wish to use and click Save.
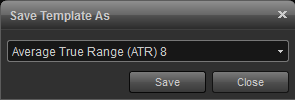
To apply the template, right-click on the study line and highlight the template you want to apply. in this example, we will use average true range (ATR) 8:

Remove [name of study]: Allows you to remove a selected study.
