<%@LANGUAGE="VBSCRIPT" CODEPAGE="1252"%>eSignal Quote Window Basics
This article will help the eSignal user to understand how to open and customize a Quote window, as well as saving the defaults for new Quote windows. The last paragraph in this article contains a link for the Quote Window Basic video training.
Opening a New Quote Window
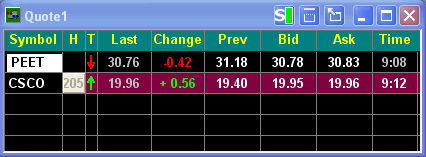
From the menu bar, click on File > New, then click Quote window from the sub-menu. It will open a default Quote window that will look like the one displayed below.
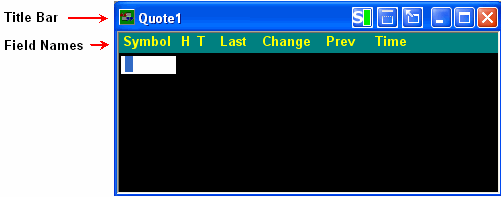
The H is the field for Headline Count, which displays the number of headlines available for a particular issue or stock.
The T is the Tick, Settlement, Closed field. This field displays a "+" and a "-" indicating if the last tick was an up-tick or a down-tick. It will also displays a ( c ) for closed, meaning that the final trading price has come in for an stock. This price serves as the temporary closing price until the settlement is released. The settlement or (s) is generally released 5-15 minutes after the final trading price. It is the official exchange close of the day for futures and commodities.
Customizing Fields in the Quote Window
Add a Field (Column)
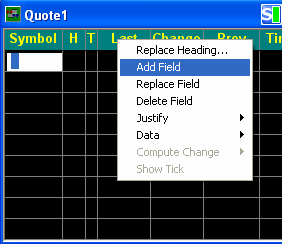
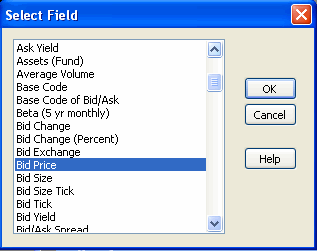
Right click the column heading (For example, Last), choose Add Field from the pop-up menu that appears. The Select Field dialog box appears, then left click on the specific column heading you want from the list, then click OK. The column heading you chose is inserted to the right of the heading you right clicked on in the Quote window.
delete a field (column)
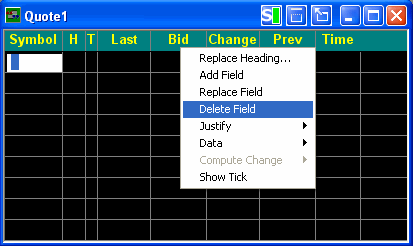
right click the column you wish to remove. choose delete field from the pop-up menu that appears.
replace a field (column)
right click the column heading you want to replace. choose replace field from the pop-up menu that appears. the select field dialog box appears and choose the type of column heading you want, then click ok. the column heading you chose in the dialog box replaces the one you selected. the data in the column changes to reflect the new heading.
adjusting column width
place the cursor on the grid line area between the two column headings and adjust the cursor until the pointer turns into a short horizontal line with arrows on each end. hold down the left mouse button and drag the line that separates the column until the column is the right size. release the mouse button and see the column heading and the column below it change to the new width.
sector lists (new with esignal 10.5)
the ability to list what symbols are in specific sectors is a powerful way to create specialized watch lists; this can now be done in esignal 10.5 with just a few clicks. to access the sector lists menu, open a new quote window by clicking file, new, quote window. then from the main menu click quote window, insert sector/industry list. alternatively, you can access the sector lists by right clicking an empty row in the quote window. 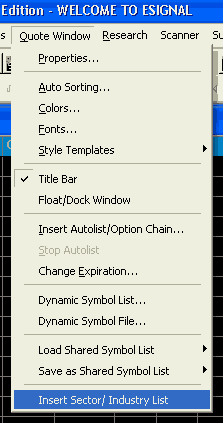
click the + sign to display the sectors within each industry. highlight the sector you wish to follow then click ok. 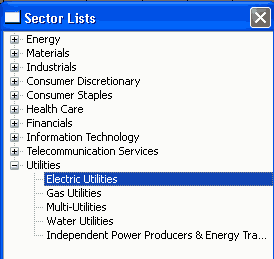
the symbols from that sector will automatically populate in your quote window.
drag and drop (added in esignal 10.3)
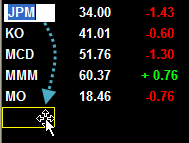
the drag and drop feature is the ability to move columns and rows in a quote window by grabbing them with a left mouse click. this feature is available on esignal version 10.3 and newer. to use drag and drop, click and hold down your left mouse button on the column header you wish to move. now move your mouse to a new location and then release your left mouse button, and the original column will move to that new location. in that same way, you can move symbols from one row on a quote window to another row or from one quote window to another quote window. first highlight the row that you wish to move. you'll notice the border around the symbol field will be highlighted. hold the left mouse click anywhere on that border and drag the row into the desired position. it can be dragged into a new row from the same quote window or another row in a separate quote window.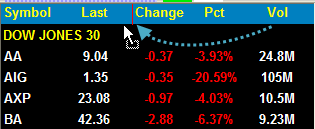
one other aspect to drag and drop is that it is now possible to drag a symbol from a quote window into a chart in order to view that symbol’s trading history. while this feature already exists via symbol linking, this additional method allows you to quickly assign a symbol to a chart that is not symbol linked.
entering symbols in the quote window
adding symbols
click in an empty row in the quote window, the cell under symbol highlights and a white outline appears. type the symbol and press 'enter'. the row should display data for the symbol that was entered.
replacing symbols
click a row with an existing symbol and the cell in which the symbol is displayed will highlight. type the "new" symbol and press 'enter'. the existing data will be replaced with the data of the new symbol being entered.
Inserting and Deleting Rows
Insert a row
To insert a row, left click in the row below where the new row will be added, hold down the Ctrl key on your keyboard and press I ( Ctrl + I ).
Also, you can left click in the row you want below the new row, and go to Edit in the menu bar and click Insert Row. Another option is to right click on a symbol in the quote window, then click Edit>Insert Row.
Delete a row
Left click on the row you wish to delete, next hold down the Ctrl key on your keyboard and press X ( Ctrl + X ).
Also, you can click the row and go to Edit in the menu bar and click Cut. A third option is to right click on the row you want to delete and click on Edit>Cut to delete it or Edit>Clear to just clear it.
Inserting Headings
A heading consists of a group of preset fields on the same row. To add a new Heading, highlight any row on the Quote Window and click Edit, then Insert Headings (also Ctrl-H ), the figure below left will display. Another way to add a new Heading is to right click on an empty row in the quote window and choose Insert Heading. Choose from the list of Standard Headings and click OK.
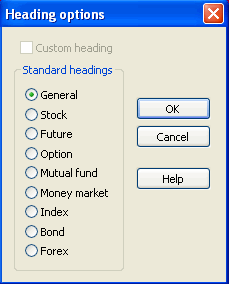
In the example below, two sets of Headings have been inserted, one for Futures and another one for Indices, each of those sets of Headings can be further customized.
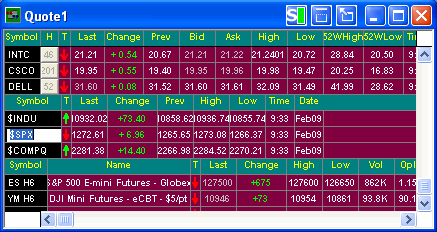
to remove inserted headings, click anywhere over the headings row to select the row (it might prompt a question about sorting, click no). go to edit and click cut or in your keyboard shift + delete.
sorting by a field (column)
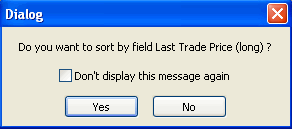
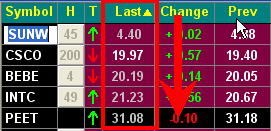
left click once in the column heading that you want to use for sorting (ex. symbol, last, change, high or low.) if you see a confirmation dialog box, click yes. (to disable confirmation in the future, select the "don't display this message again" check box.) the first time you sort, rows arranged in descending order. after that, sorting alternates between ascending and descending order for that column. sorting is done alphabetically for fields that contain text and numerically for data fields.
for example, left clicking last, displays the following dialog box asking "do you want to sort by field last trade price?" notice that the last price values are displayed from the lowest to the highest.
grid lines
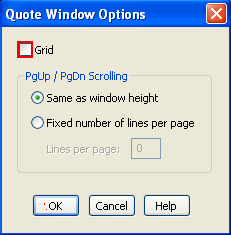
to add grid lines, go to quote window on the menu bar, and click properties. put a check mark next to grid, and click on ok.
adding words or comments to a row
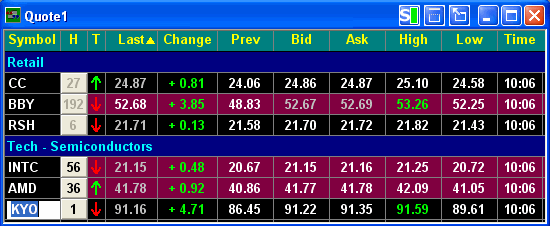
you can customize your quote window rows with text comments instead of symbols. for example, a stock trader might want to add a comment or divider line that says, "retail." to do this, click on a row and type #retail then click the enter or down direction key. that row should now read, "retail," as seen below.
Add Comment Column
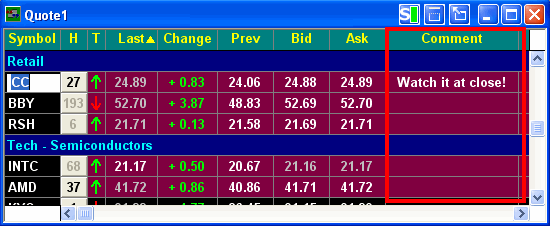
Right-click in the column heading to the left of the place where you want the comment column to appear. Choose Add Field from the pop-up menu that appears. In the Select Field dialog box, choose Comment, then click OK. To enter text into a Comment field for a symbol, double-click in the field, enter the text in the dialog box that appears, then click OK. To see the full text of a comment after it has been entered, or to edit the comment, double-click on the field again.
Changing Colors and Fonts
Changing Colors
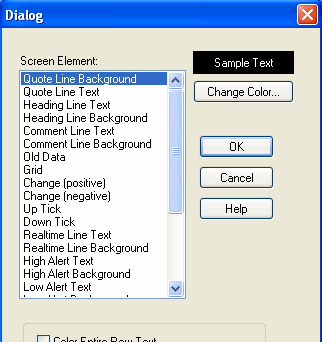
Click on the Quote window to make it the active window. Go to Quote Window on the menu bar and click Colors. A dialog box will open. You can click each Screen Element line to see the current default colors in the Sample Text box. To change a screen element color, click on that element from the list. Next, click on the Change Color button to bring up the color list. Click on the color that you want and click the OK button to make the change. The new color should be visible in the Sample Text box so you can preview it. Click the OK button to save your new color.
Changing Fonts
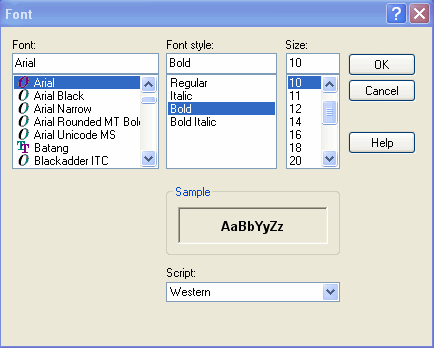
Click on the Quote window to make it the active window. Go to Quote Options on the menu bar then click Fonts. The Font dialog window will open, the top three boxes will be displaying the current defaults for Font, Style and Size.
Make necessary changes and click OK.
Saving New Defaults (Preferences)
After you have finished customizing the quote window, you can save the settings as the default settings so any future quote windows you open will have the same settings. To do this, click on Quote Window on the menu bar, then Style Templates>Set As Default. The next time you open a quote window, it will have your default settings.
Right Click Features
When you right click in a Quote window data row, you see some or all of the following commands, depending on the type of issue displayed in the row. This allows you to view any of the following windows for that listed issue: Advanced Chart, Standard Chart, Time and Sales, Time and Quotes, News, Market Depth, Option Chain, Detail Window, Fundamental, Company Profile, Research, Fundamentals & Analysis, Corporate Actions, Reorganizations, Set Alert or Edit.
In addition to the information contained in this article, we also provide video training on working with the Quote Window.
Quote Window Basics