Advanced Charting - Price Filtering
Located under Tools in the menu bar, the Price Filtering tool quickly identifies bad ticks from the exchange.
The filter allows you to set a % range or % average range of a bar compared to the bars before and after. If a price comes in that is outside the filtered range, it will be displayed in a different color and will not be used to calculate any studies or to set chart scaling so that you can see the data that doesn't fit. Another way to apply this tool is by right-clicking the mouse inside the chart, then selecting Tools and Price Filtering. To add Price Filtering, select Tools, then Price Filtering.
Place a checkmark in the box nest to Enable to enable the filtering. Default values are 100% for % range of nearest bars and 50% for % average range from nearest bars. Enter your desired % range of nearest bars and the %average range for nearest bars. Click OK.
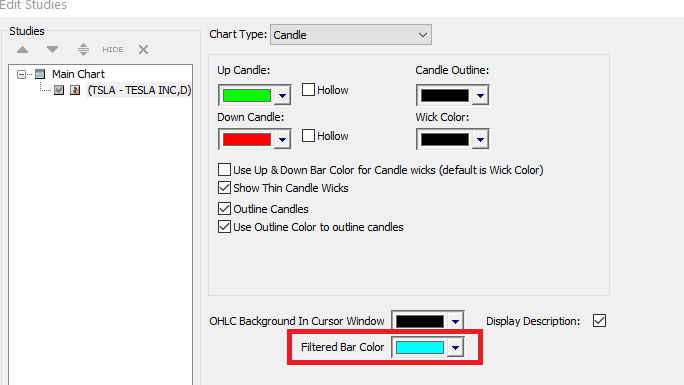
Edit Filtered Bar Color
To edit the colors of your Price Filter, right click on the chart, select Edit Studies, and select the color from the color palette in the Filtered Bar Color menu.
