Overview
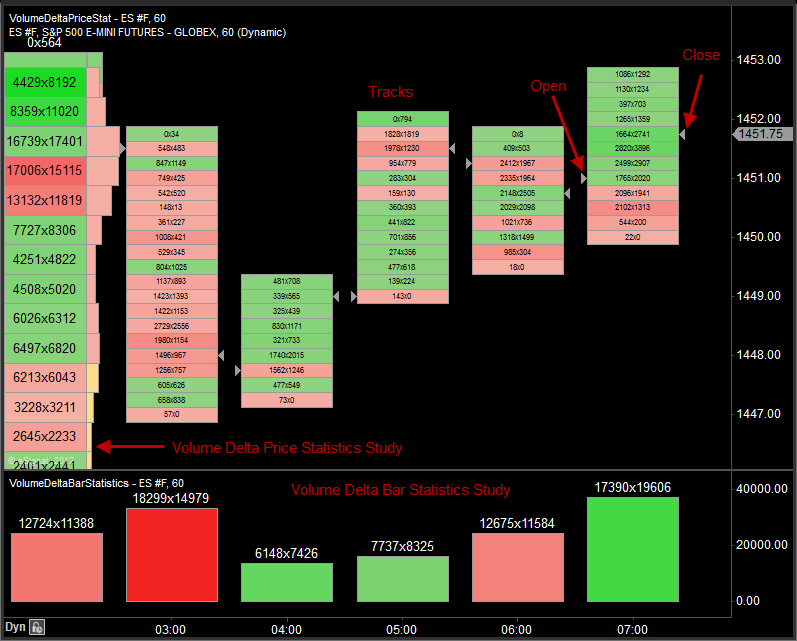
The Volume Delta chart type allows traders to look inside a bar or candlestick to see whether buyers or sellers had control at any specific price level. Two studies, Volume Delta Price Statistics and Volume Delta Bar Statistics can be added to Volume Delta.
Volume Delta will work on any symbol that has Bid, Ask and Trade data. It must have all three in order to properly calculate this chart type. This means it will work on most markets except indices and Forex symbols.
Note: Only Intraday intervals can be used with this feature.
When more buying takes place at or above the Ask price, the "tracks" are colored green. Likewise, when more selling is taking place at a specific price level (more trades are being filled at or below the Bid), the tracks are in red. The more dominant one side is, the brighter that color becomes, resulting in a clear picture as to where the pressure points are.
Applying Volume Delta to a Chart
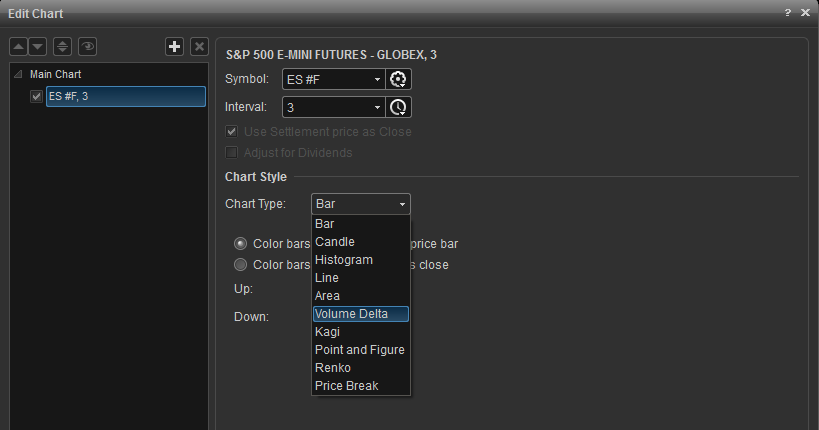
To apply Volume Delta to a chart, right-click in the chart window and select
Edit Chart. Click on the
Chart Type dropdown menu and select
Volume Delta.
Volume Delta Chart Properties
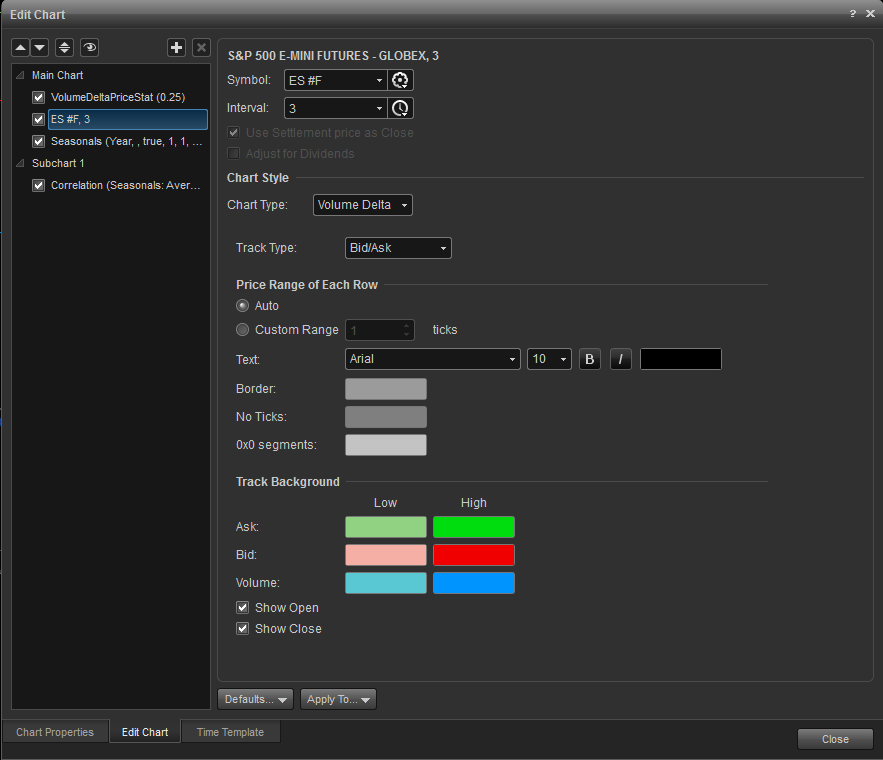
To edit the Volume Delta Chart parameters, right-click anywhere in the chart and select Edit Chart. Highlight the chart currently displayed in the left panel (ES#F, in this example).
Symbol: Select the symbol of the issue to be displayed.
Interval: Select the time frame for the issue.
Track Type: Select the type of data that the tracks will be based on: Bid/Ask, Delta, Delta Percent, or Volume at Price.
Price Range of Each Row: Set to automatic or choose a custom range (i.e. # of ticks)
Track Background: Specify the high/low colors for Bid, Ask, and Volume.
Show Open: Toggle the display of Open indicator.
Show Close: Toggle the display of Close (Last) indicator.
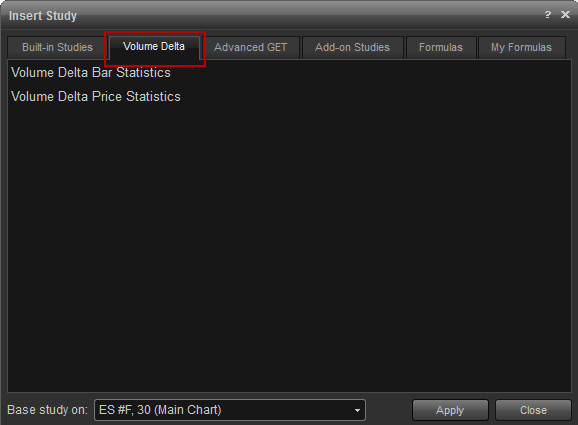
Applying the Volume Delta Bar Statistics and Volume Delta Price Statistics
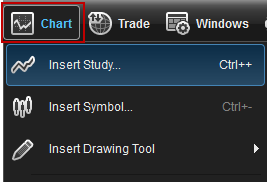
To apply the Volume Delta Bar Statistics and Volume Delta Price Statistics studies to a chart, left-click on the
Chart icon on the main menu bar and select
Insert Study from the drop-down menu.
Alternatively, you can also right-click on the chart, when the menu appears, left-click on
Insert Study.
Volume Delta Price Statistics Study
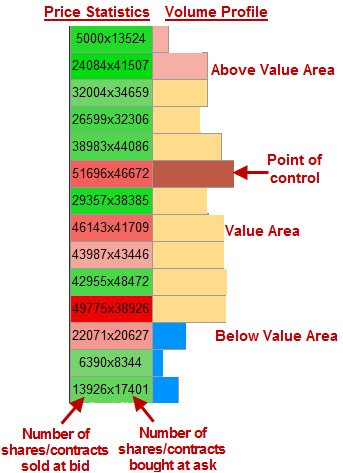
This study has two components, Price Statistics and Volume Profile:
Volume Delta Price Statistics displays the total volume at the bid and at the ask for each price point for all the chart data that is loaded. This lets you see where the majority of buying and selling is taking place over a sample size of your choosing. When more buying takes place at or above the Ask price, then the “Tracks” are colored green. Likewise, when more selling is taking place at a specific price level by more trades being filled at or below the Bid, then the Tracks are in red. The more dominant one side is, the brighter that color becomes leading to a clearer picture as to where the pressure points are at.
Volume Profile gives a picture of how much total volume is at each price level, similiar to a Market Profile chart. The maroon colored bar is the Point-of-Control, or the price where the peak volume traded at. The horizontal yellow bars are within the Value Area, which is 70% of the chart’s volume starting from the Point-of-Control; the blue bars are outside of the Value Area.
Properties for the Volume Delta Price Statistics Study
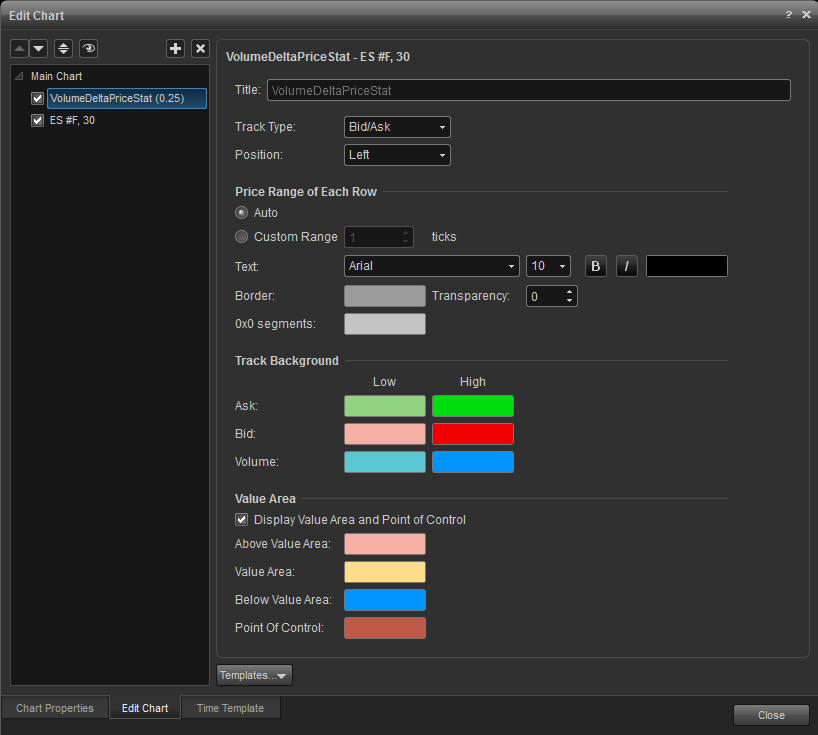
To edit the study parameters, right-click anywhere in the chart and select Edit Chart. Highlight the Volume Delta Price Statistics study displayed in the left panel.
Track Type: Select the type of data that the tracks will be based on: Bid/Ask, Delta, Delta Percent, or Volume at Price.
Position: Set the display of the study on left or right side of the chart window.
Price Range of Each Row: Set to automatic or choose a custom range (i.e. # of ticks) and select fonts and colors.
Track Background: Specify the high/low colors for Bid, Ask, and Volume.
Display Value Area and Point of Control: Toggles the display the Volume Profile value area and Point of Control and select the display colors.
Volume Delta Bar Statistics Study
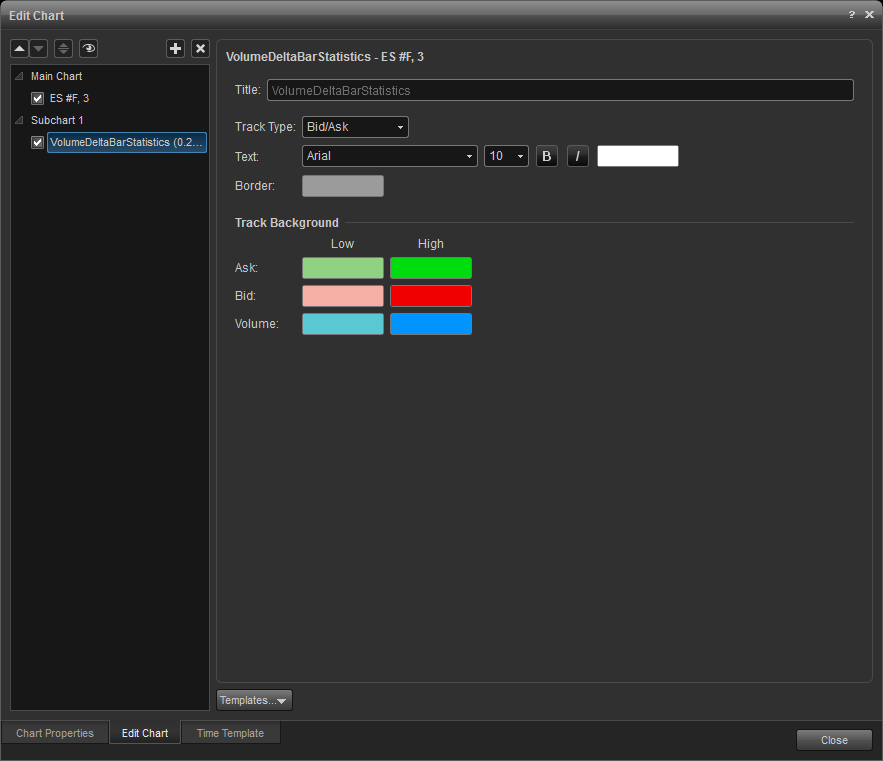
At the bottom of chart is the second study offered, Volume Delta Bar Statistics. This study shows the volume for each bar and is, once again, colored based on whether the buyers or sellers were in control of that bar.
Properties for the Volume Delta Bar Statistics Study
To edit the study parameters, right-click anywhere in the chart and select Edit Chart. Highlight the Volume Delta Bar Statistics study displayed in the left panel.
Track Type: Select the type of data that the tracks will be based on: Bid/Ask, Delta, Delta Percent, or Volume at Price.
Text: Select fonts and colors.
Track Background: Specify the high/low colors for Bid, Ask, and Volume.
FAQ
What is a 0 x 0 trade block in a Volume Delta chart?
0 x 0 indicates no trades (or 0 volume trade in the case of Settlement tick) at that segment within a track. For example if a trade occurs at 99.00 followed by a trade at 100.00 and the minimum tick is 0.10. All the displayed segments contained between 99.00 and 100.00 will display 0x0. The same for a Settlement tick at the end of the day since it has 0 volume.
While the chart can be interval based the bars are in fact tick based. The tick server has to build them using tick data which is why charts can take quite some time to plot, especially if the security being charted is a high volume one such as TSLA.
In general it may be best to use a fixed Time Template so as to contain the amount of data being downloaded every time.
