In addition to the information contained in this article, we also provide video training on working with the Market Depth Window
Market Depth Basics
The Market Depth refers to a more detailed level of quote data that displays multiple levels of price quotes beyond the inside bid and ask. Each price level has a MMID, or Market Maker ID, that means different things depending on the type of data displayed. For instance, for NASDAQ Total View the 4-letter abbreviation represents the actual NASDAQ Market Participant that is listing that bid or offer. For more information about Market Depth pricing, please click here.
| Market Depth Options | SingleBook |
| Net Order Imbalance | Acra ECN |
| TotalView | NYSE Open Book |
| Regional | tsx book |
market depth window overview

level 1 quote area
displays level i information. to customize the quote area, double-click the mouse within that quote area to open the "field select" window. to add a particular field, click and drag the field inside the quote area.
market depth toolbar
this bar consists of the symbol field, the link butoon , and the server status. it is located below the quote area.
depth meter: using color levels, this bar represents the amount of size being bid / ask by the market makers at any particular level. in the picture above "yellow" signifies the highest bid or lowest ask quote. the depth meter is located below the market depth toolbar.
level ii quote area : by default, the level ii quote area displays the mmid, bid, hsize, time and mmid for ask, hsize, and time. the bid and the ask columns will display green and red arrows representing an increase or decrease of bid / ask previously posted by one of the market makers. hsize stands for histogram size and is simply a duplication of the bsize and asize columns with a histogram bar within it. the histogram bar is a graphical representation of the size in relation to the other sizes in the column.

the four letter ids are capitalized for nasdaq market participants and are in lower case for non-participants. non-participants come in two types. the "u" in front designates them as utp (unlisted trading participants) and applies to ones such as 'cinn', and 'arcx'. the "o" in front designates them as omdf (otc montage data feed) and applies to ones such as 'ntrd'
time and sales ticker
the time ans sales ticker will display the time. mm. bid/ask, price and size of the issue for which data is being displayed. to change settings of the t&s ticker, right click the mouse in the market depth window and click on ticker properties. this properties window will allow you to change the display, mm quote colors, and trade colors.
market depth options
when you right click in the market depth window, you see some or all of the following commands.
send image to - select send image to from the market depth right-click menu to send an image of the active market depth window to either a local file, to the file share, to a lesson, to the clipboard, or to the ftp server.
dome(depth of market) - this function will split the bid/ask data field horizontally displaying the ask data on top and bid data at the bottom of the screen.
style templates - select style templates to load a particular style template, to save a market depth window as a style template, to set a particular market depth window as your default style template, or to load the default market depth window style template.
title bar - clicking on title bar will will toggle the blue title bar at the top of the market depth window between the normal (visible) and minimized states. if the title bar has been minimized, clicking the thin black line in the upper right corner will restore the title bar to the normal mode.
float/dock window - if this selection is not checked, the market depth window will be anchored, or docked on the main esignal charting screen. if it is checked, the window will be undocked so that it can be moved to another monitor. the icon with the arrow pointing out of the upper left corner of the rectangle will change so that the arrow is pointing back into the rectangle and a pushpin icon will appear next to it. after the chart has been moved to another monitor, click the pushpin icon so that it goes to a 45 degree angle. that will anchor the window to the other monitor. if you forget to anchor the window, it may float around and you may lose track of it.
show quote area - select show quote area to display a quote area for the market depth window symbol at the top of the market depth window. deselect show quote area to remove the quote area.
show data buttons - select show data buttons from the market depth right click menu to turn the display of the market depth data buttons on and off. this command acts as a toggle and is on by default. the data buttons (level ii, regional, totalview, singlebook, arca, nyob & tsx/book) enable you to isolate market depth window data from a specific ecn, to quickly view a montage or, to view nyob (nyse open book for nyse issues).
market depth properties - select properties from the market depth window right-click menu to specify text, color, price and size change options and market maker options.
market depth ticker properties - select ticker properties from the market depth right-click menu to specify market maker quote colors, trade and background colors and other data options.
button properties - select button properties from the market depth right click menu and the show/hide buttons dialog box appears. you can select/deselect the buttons to be displayed in the market depth window in this dialog box.
market depth price filtering - select price filtering from the market depth right-click menu to filter bid and ask prices that appear in the market depth window based upon their distance from the inside market (in dollar or percentage terms).
market depth market makers - select market makers from the market depth right-click menu to specify the market makers that you want to follow and/or hide.
integrated trading - select integrated trading to link to your integrated trading broker or to use the esignal paper trading feature.
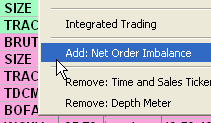
add: net order imbalance - select to add net order imbalance to the market depth window.
remove: time and sales ticker - select to remove the time and sales ticker from the market depth window.
remove: depth meter - select to remove depth meter data from the market depth window.
net order imbalance
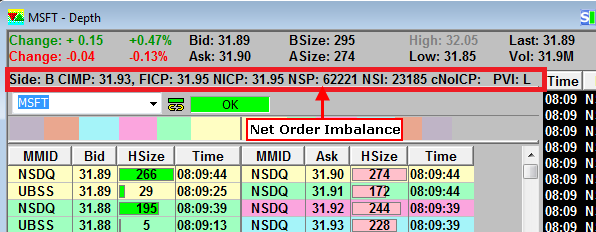
starting in july 2005, nasdaq and esignal has teamed up to provide the nasdaq opening and closing cross data to nasdaq totalview subscribers. this data, known as the net order imbalance indicator or noii, gives a look into the supply and demand forces that affect the opening and closing prices.

to add the net order imbalance indicator to your market depth window, click on the market depth menu at the top of esignal and select add: net order imbalance.

an alternate method for accessing this feature is by right-clicking in the main body of the market depth window, and selecting add: net order imbalance.

to remove the net order imbalance, right click the mouse inside the market depth window, click remove: net order imbalance.
more information about the net order imbalance can be found in this article.
market depth tabs

regional tab
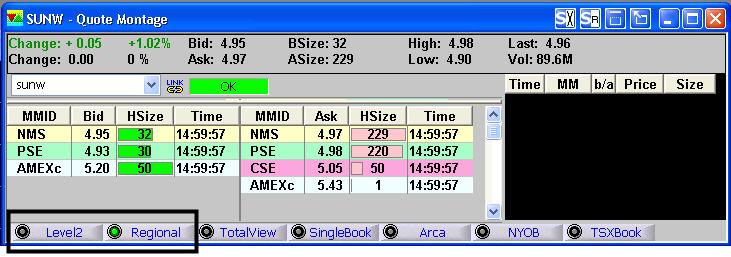
with esignal version 10.0 and newer, there is now regional data for nasdaq symbols as well as the listed exchanges, so it has become necessary to break out the montage tab and replace it with a level 2 and a regional tab to allow users to pick which type of data they want to see.

the regional tab will now be used for nasdaq symbols in addition to the listed symbols that esignal had already been able to display regional data for. to open a market depth window, click file, new, market depth (or use the new window icon).
regional options data
you can view regional options data in the market depth window if you subscribe to esignal’s regional options service. to view regional options, right-click on an options symbol, then select market depth. when the market depth window appears, click the regional tab.
when you open a market depth window and display regional options, the quote area at the top of the window displays the inside market (best bid and best offer) prices and total size available at these prices.
regional exchange quotes for the option contract appear in the data area of the market depth window. if your market depth window is set up to display a vertical ticker, the ticker will also scroll regional options.
for more information on regional options click here.
nasdaq totalview tab
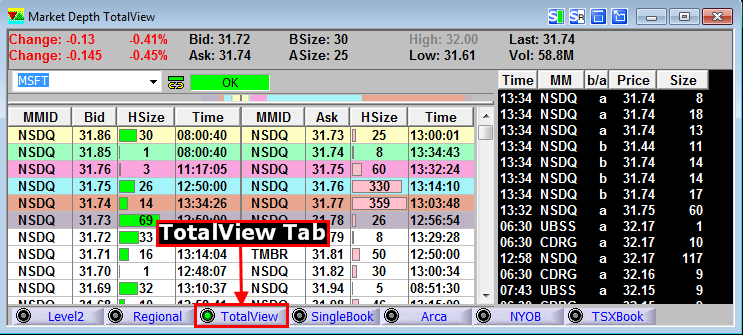
totalview enables traders to view multiple quotes from market makers to buy or sell a stock. the advantage to you is the ability to see multiple quotes from the same market participant plus anonymous postings. having more market depth data than a level i or level ii quote can certainly make a difference in seeing the complete picture.
accessing total view in a market depth window
there are two ways to access total view data in a market depth window:
1. Select File > New, and click on Market Depth > click on the Total View Tab at the bottom of window.
2. from a quote window > right click on a symbol and select market depth from the menu > click on the total view tab at the bottom of window.
singlebook
to compliment the change listed above, nasdaq is now also offering a "single book" service which will show nasdaq book depth on listed symbols as well as the nasdaq symbols already included. at the same time, the island book has been merged into nasdaq's totalview service, so that tab has been replaced with the new singlebook tab. you must have a subscription to totalview to see data on either the totalview or singlebook tabs.
arca tab
the archipelago ecn is available in the esignal market depth window by choosing the arca button at the bottom of the window. all information displayed in this view is specific to all order activity on the arca ecn.
the arca (archipelago) ecn or electronic communication network is a component of the esignal market depth window. ecn’s are electronic networks that allow the individual trader to connect their orders to major brokerage houses and bypass the middleman when routing a particular order to buy or sell a stock. over the past few years, ecn’s have undergone several consolidations to form larger entities that offer increased liquidity.
for more information on arca enc click here.
NYSE Open Book (NYOB)
The New York Stock Exchange is now offering Open Book, a real-time view of the specialist's limit-order book. The NYSE OpenBook provides aggregate order volume information for all bids and offers on all NYSE-traded issues between 7:30 AM EST and 4:30 PM EST. Access to NYSE Open Book will now enable off-floor market participants to gauge the depth of the NYSE limit-order books.
NYSE Open Book data is available to eSignal subscribers as an add-on service. If you subscribe to NYSE Open Book data, you will be able to view this data the eSignal Market Depth window.
To view NYSE Open Book, open a Market Depth window using the File>New>Market Depth. Once the Market Depth window opens, just click on the NYSE Open Book button (labeled NYOB) that appears at the bottom of the window.
For more information on NYSE Open Book click here.
Canadian Depth and TSXBook
Market Depth for Canadian data is now available under the Level 2 tab (subscription required) and a new TSXBook tab has been added. Pro and Non-Pro users have the option of viewing aggregate pricing on the Level 2 tab by subscribing to Market By Price while the TSXBook tab for full book view is available to Pro users only. Please note that pricing is separate for Canadian vs. Non-Canadian users. You can mouse over the MMID to display the broker name. Please click here to access a list of the TSX broker names.
Technical Notes: We are currently sending the Top 50 orders, on each side, in a depth window. That means other orders may exist but they won't display unless they are among the Top 50 on each side. We also limit the active desktop to 12 depth windows at one time. Any other depth window opened will return a "no data" status.
For Market Depth window troubleshooting tips click here.