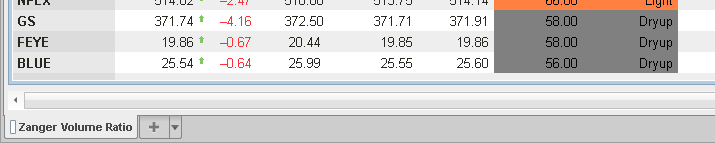
simply install the latest version of esignal and a tabbed page labeled "zanger volume ratio" will be added to the bottom of your screen. you can also download the page from here.
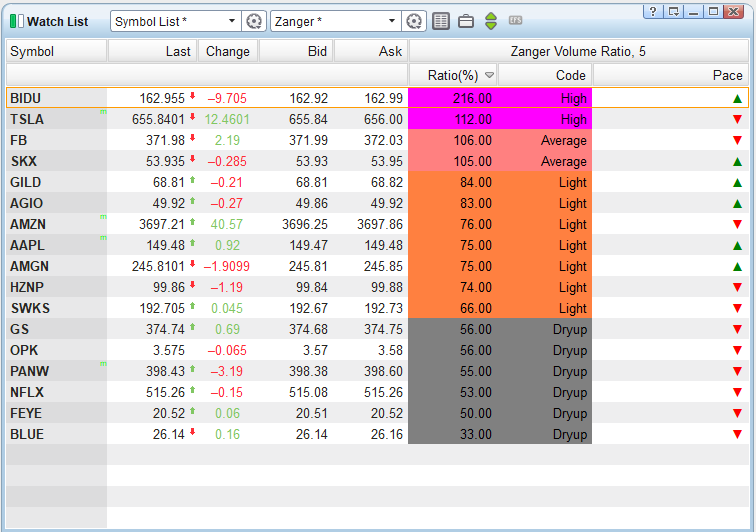
you'll find a sample watch list with the zanger volume ratio applied. the 3 displayed columns are ratio, code, and pace.
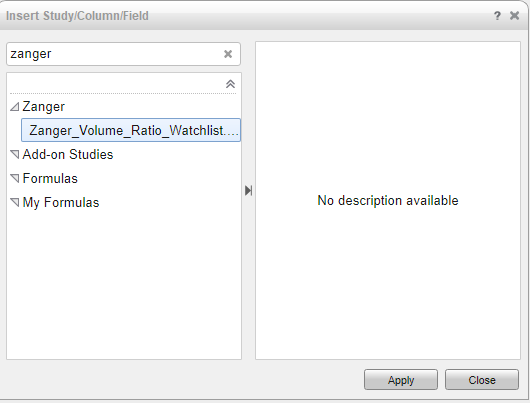
to add the study to an existing chart, right click the chart and select insert study. choose the zanger tab shown below and select zanger_volume_ratio_watchlist.efs.
the study will be applied in a separate pane towards the bottom of the chart:
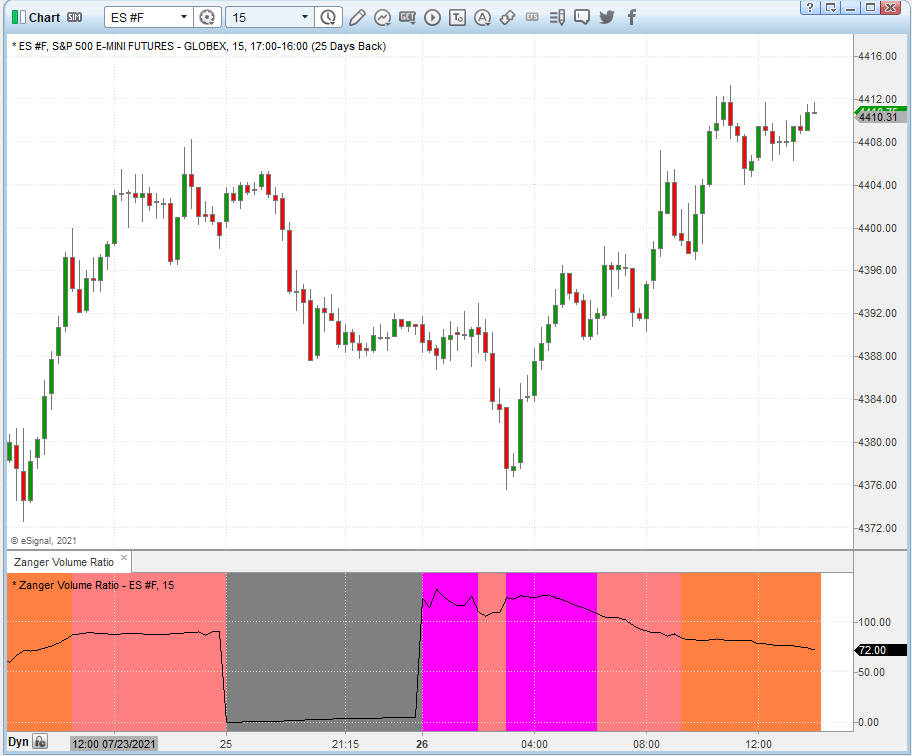
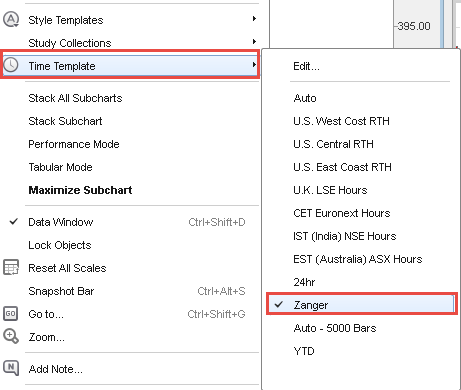
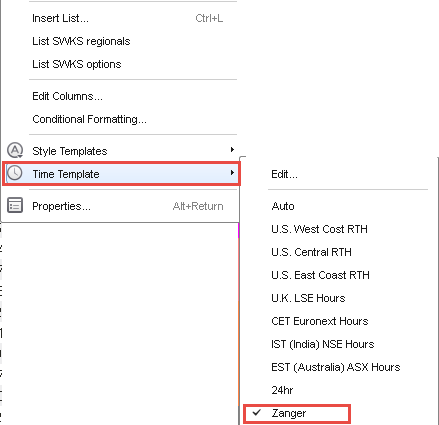
the zvr study requires certain amount of data to be loaded in the chart and watch list or else the zfr wiil be grayed out. a time template set to load 25-days of data can be found under time template.
to apply the time template to a chart, right-click the mouse inside the chart, then select time template and click the zanger time template.