Advanced GET Studies - GET Williams %R
Overview
GET Williams %R is a momentum indicator that measures overbought/oversold levels. It was developed by Larry Williams. The interpretation of Percent R is very similar to that of the Stochastic Oscillator, except that GET Williams %R is plotted upside-down and the Stochastic Oscillator has internal smoothing. To display the GET Williams %R is indicator on an upside-down scale, it is usually plotted using negative values (for example, -20 percent). (For the purpose of analysis and discussion, simply ignore the negative symbols.) Readings in the range of 80 to 100 percent indicate that the security is oversold, while readings in the 0 to 20 percent range suggest that it is overbought.
As with all overbought/oversold indicators, it is best to wait for the security’s price to change direction before placing your trades. For example, if an overbought/oversold indicator (such as the Stochastic Oscillator or GET Williams %R is ) is showing an overbought condition, it is wise to wait for the security’s price to turn down before selling the security. (The MACD is a good indicator to monitor change in a security’s price.) It is not unusual for overbought/oversold indicators to remain in an overbought/oversold condition for a long time period as the security’s price continues to climb/fall. Selling simply because the security appears overbought may take you out of the security long before its price shows signs of deterioration.
Please note that you must purchase Advanced GET to access this study.
How do I apply the GET Williams %R study?
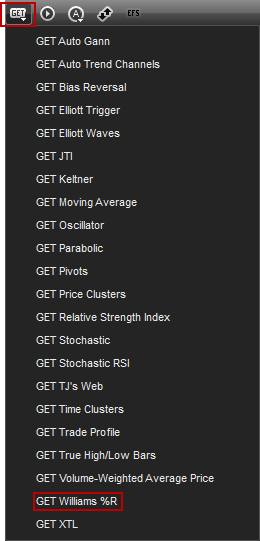
To apply the GET Williams %R study to a chart, left-click on the GET icon and select GET Williams %R from the drop-down menu.
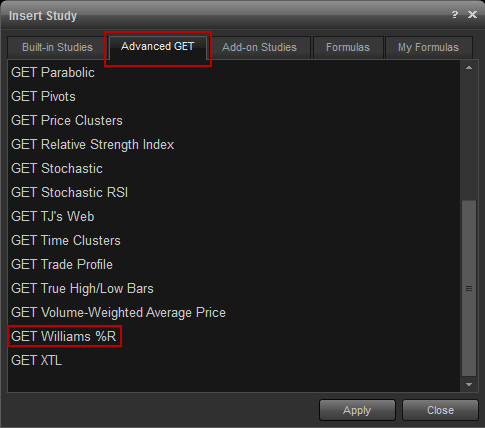
alternatively, you can also right-click on the chart, when the menu appears, left-click on insert study, left-click on the advanced get tab and then select get williams %r.
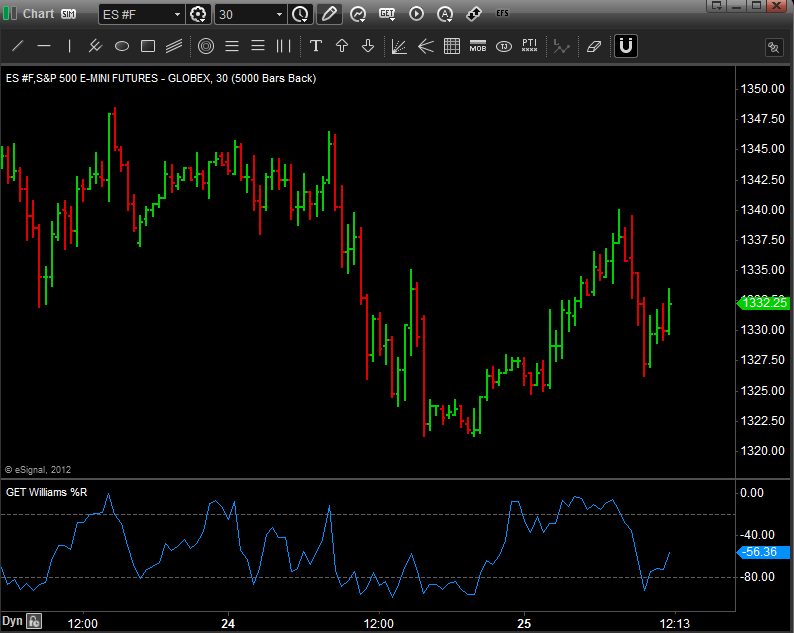
the get williams %r study will then appear in a study pane of the chart window.
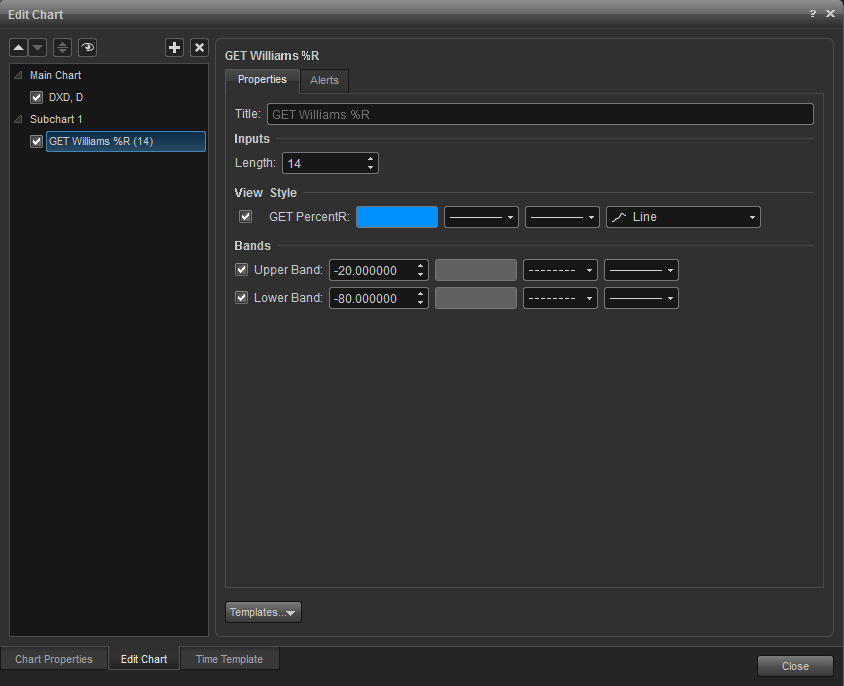
Properties
To edit the GET Auto Gann study parameters, either right-click on the chart and select Edit Chart or right-click on any of the lines of the study and select Edit.
Alerts
Select the Alerts tab to set an alert for when the study crosses the Upper or Lower Band line or crosses a set level.
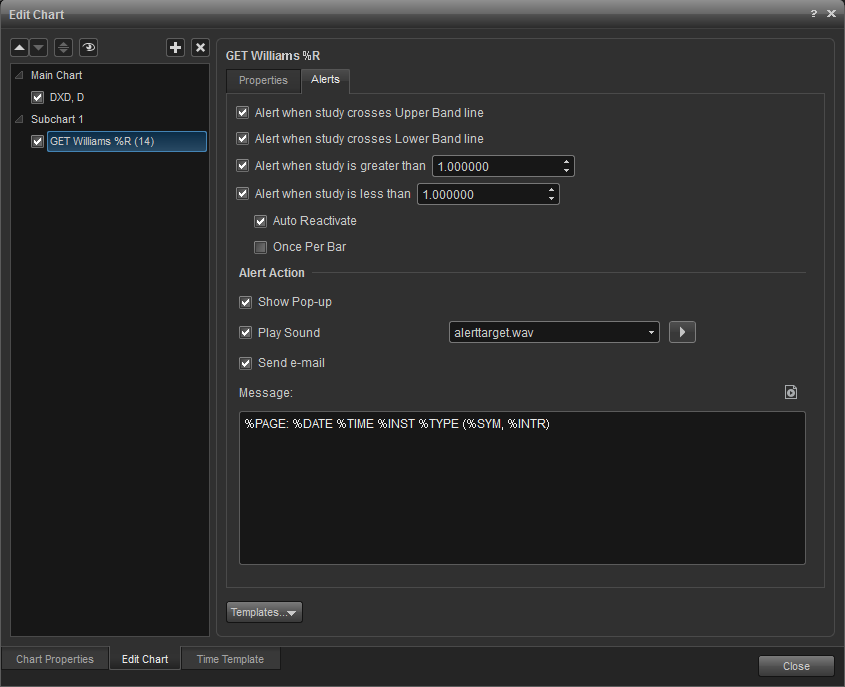
Alert Area: Select the minimum of number ticks that price has to be within the range of a study line or set it "0" if the price must cross the study line to trigger an alert.
Auto Reactivate: When checked, the alert will reactivate so it can be triggered again.
Once per Bar: When checked, the alert will not trigger again until the price bar forms.
Alert Action: Select for when an alert triggers, to get a pop up alert, an audio alert, and if configured, an e-mail alert message.
Once per Bar: When checked, the alert will not trigger again until the price bar forms.
Alert Action: Select for when an alert triggers, to get a pop up alert, an audio alert, and if configured, an e-mail alert message.