Studies and Formulas
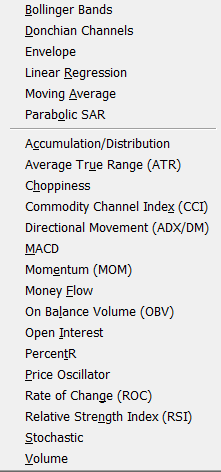
Technically, there is no difference between the words "study" and "formula." Both words are used in the industry to refer to technical analysis/technical indicators that, when applied to the "raw" market data, help the trader make sense of the numbers (that is, buy or sell, go long or short?). In fact, we use the word "study" for all of the types of technical analysis we now have available in eSignal.
In reference to eSignal, we have four types of studies, three of which are hard-coded (that is, you cannot change the programming behind them) and one type of study (called formulas or formula studies) that are written in JavaScript that can be edited and reprogrammed.
So, when you see the word "formula," you'll know that the study is programmable.
Types of Studies, Formulas and Tools
The analytical charting tools in eSignal are divided into the following categories:

Basic Studies
The 20+ hard-coded studies available in the Advanced Charts, on which some of the settings allow for more customizing than the standard set. The programming behind these studies cannot be changed.
Premium Addon Advanced Studies
These are proprietary technical indicators that you can add to your eSignal Subscription for an extra fee (examples: Bollinger Bands Jan Arps Traders' Toolbox Crown Jewels. These are also hard-coded, so the programming cannot be changed.
Customizable Formula Studies
This term refers to the over 75 (soon to be more) formulas included with the Advanced Charts, the programming of which can be modified at will using the JavaScript-based editor function now part of eSignal.
Formulas EFS
The eSignal software allows the users to change the programming in the existing formulas or to create their own formulas.
To access the EFS Editor, go to Tools in the main Menu Bar, then EFS, then left click on Editor.
Applying Formulas - Moving Average with the Volume Histogram
There's a VolumeMA.efs formula in the Library folder. You can add it by right-clicking on the chart, going to Formulas, selecting the Library folder, then clicking on the formula.
This is a 13 bar average by default, but you can change it to any number you like in the Edit Studies window. Just right-click on the formula after you've added it and select Edit Studies. Here, you can change the length and then click OK. The label on the chart will now have that number in parentheses after it.
This formula only shows the MA, but you can merge it with the Volume study if you want to see it on top of the Volume study. To merge, make sure you also have the Volume study on the chart. Hold down the Shift key on your keyboard and then drag one of the two studies on top of the other with a left mouse drag and let go. To be sure you keep these studies set up correctly, please save the chart or save a Style Template once the chart is the way you want.
Merging Studies
You can merge two or more studies, as well as overlay studies over the bars in the chart, sharing a common scale in order to display properly. To perform this, hold down the Shift key while dragging one study on top of another. While doing this, you should see a gray outline moving with the mouse. To un-merge studies, right click within the merged studies and choose Un-Merge Studies.
Moving Studies
Indicators that when added to the chart are displayed in a separate pane below the chart can be repositioned. For example, if you add the MACD to the chart but you will like it to display above the candles or bars, you can reposition it by holding down the Control key; then click and drag the study to your desired location. In the example below we drag it from the bottom to the top of the chart.
Changing the Settings and Colors
To change the study settings and colors, right click the mouse within the study and then choose "Edit Studies." A window called Study Properties will open in your screen, in the upper-left hand corner you will find a box labeled "Study", which will list all studies applied to the chart. Select the study that you want to change , then click OK.
Volume Study
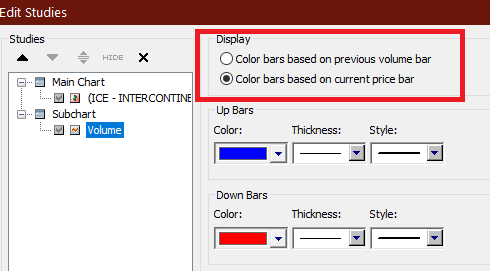
For Volume there are 2 different Display options:

Color bars based on the current price bar is the default setting. This setting will set the volume bars to match the up or down setting of the price bars. If the price bar is up (Close is higher than the Open), the volume bar will be painted in the Up color. If the price bar is down (in this case Red), the volume bar will be painted in the Down bar color.
Color bars based on the previous volume bar. This setting paints the volume bar up or down in relation to the previous volume bar. If the volume was down compared to the previous day, that bar will be painted in the down bar color. If the volume is up compared to the previous day, the bar will be painted in the up bar color.
Stacking Studies
When you add indicators such as MACD and Stochastic to the chart, they will display in their own pane below the chart (Fig. 1). If you will like to see only one study at a time, right click the mouse inside the chart and select Stack Studies. Only one study will be displayed and tabs will be added for the other studies.

Once studies are stack, to see all studies back in a tile mode below the chart, right-click the mouse inside the chart and select Tile Studies.
Removing Studies
You can remove one study at a time or remove all studies at once. Right-click on the study you would like to remove, then choose Remove next to the name of the study or you can choose Remove All Studies.