Advanced Charting - Toolbars
Advanced Chart Toolbar
The Advanced Chart Tool Bar allows for shortcuts such as changing the chart type, scaling in the chart, adjusting the bar width and spacing, remove items from the chart, reset the chart to original display and gives access to the chart properties.

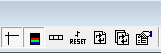
Chart Types Scaling/Bar Width and Spacing
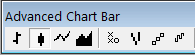

Toggle Cursor Window On/Off and Refresh chart
Trade from the Charts
This feature is no longer available in eSignal 10.6. For integrated trading please use the latest version of eSignal.
Line Toolbar
The Line toolbar allows quickly access to the drawing tools, Fibonacci lines, draw text in the chart, erase lines, zoom in/out, and also to move and copy lines.
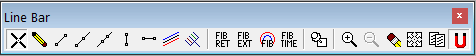
The first icon in the Toolbar is the Pointer  which is turned on by default.
When you click on one of the drawing tools the pointer shows a picture for the selected drawing tool. Once the line is draw, the pointer is still set to draw more lines. To return to the actual Pointer click the Pointer icon or it can also be disabled by right clicking the mouse.
The Line icon ![]()
allows the user to draw any of the lines in the chart. To change the default settings Style type, Color, Width and to turn on the Price Ruler. Right click the mouse over the Line icon. This will open the Trends Lines dialog window.

The different Style types are Arrow, Ray, Segment, Horizontal, Vertical, or Extended line.
These group of icons allows the user to draw a Ray, Segment, Horizontal, Vertical, Extended lines, as well as a Regression Trend Channel, which is calculated using the the actual prices of the bar in the trend, and the Pitchfork, which is made up of support and resistance lines..
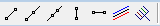
These group of icons allows the user to draw Fibonacci Retracement, Extension, Circle, and Time lines.

The Text icon ![]()
allows the user to add notes (text) to the Advanced chart. Click the icon and then left click inside the chart, a box labeled Text will open, typed the note, then click OK. The text will attach to the mouse until is set in the desired location by left clicking the mouse.
To remove text from your chart, put your mouse cursor on top of the text that you want to erase and right click. When the Text properties sheet appears, press the Remove.
The Zoom In/Out tool icons allow the user to enlarge certain areas of the chart.

The Eraser tool allows to erase any item that has been drawn on the chart by any of the Drawing tools.

The Move tool allows to move any item that has been drawn on the chart by any of the Drawing tools.
![]()
The Copy tool 
is used to copy a line or many lines on the chart. This is very useful when you are drawing parallel lines or channels. To copy a line, click on the "Copy" icon; then place your cursor on top of the line(s) that you want to copy and then press your left mouse button. It will copy the line you selected and attach it to the mouse cursor. Move this line to where you would like it to go, and click your left mouse button one more time to anchor it in place.
The Magnet tool 
adds a price magnet. A magnet controls how much force is used to pull the cursor to the high or low of the bar when drawing any kind of line from the Line Toolbar.
Hints and Tips: You can set defaults for the Line Toolbar by right clicking on one of the icons. For example, if you right click on the Text icon , you can set the default for the font size, style, etc.
Advanced Line Toolbar
The Advanced Line Toolbar is a tool bar that works only with the Advanced GET Studies, subscription to the Advanced GET Studies is required in order for that toolbar to be active.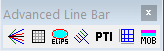
To move any toolbar, put the cursor right side of the toolbar and hold down the left mouse button while dragging the mouse. The outline of the box should appear in gray. While holding down the mouse button, move the Toolbar to the desired location on the chart, then release.