what is the hot groups scan?
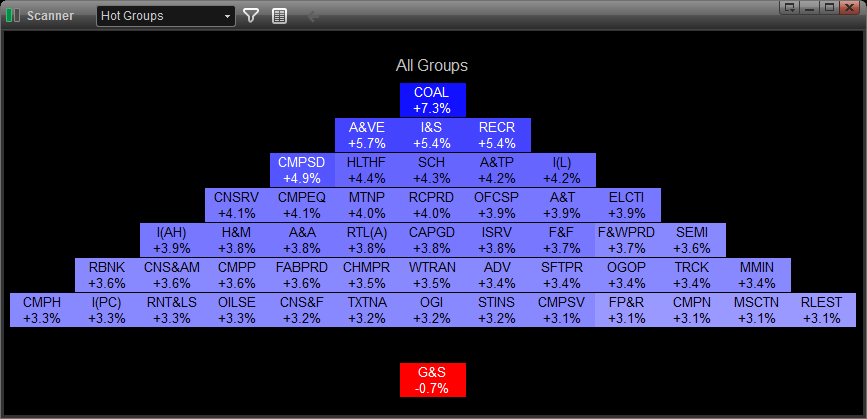
hot groups scan automatically scans the entire market to display trading opportunities by sector in real time. (information is displayed in a pyramid format with colors denoting best-to-worst opportunities.) set the minimum number of stocks per sector to give you the best results. drill down to view companies that make up each sector to zone in on stocks of interest. plus, access charts, news and company research to learn more about each potential trading opportunity.
how to add the market scanner to your services:
the hot groups scan is included in both the power and turbo packages. both packages require subscription. please click here for price information. you can add this service through account maintenance. for hot groups data for nasdaq, you must add the nasdaq exchange to your services.
opening a hot groups scanner
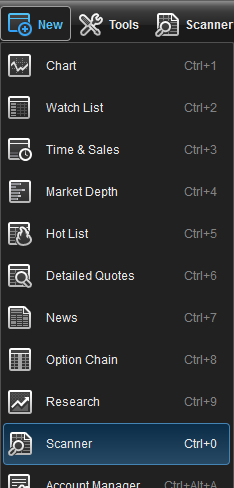
the hot groups scanner can be open within the esignal program by going to new, then scanner from the main menu bar.
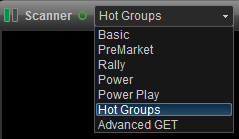
select hot groups in the upper left hand corner of the scanner window.
view type
you can toggle between traditional veiw and table view by clicking on the traditional/table view toggle button at the top of the hot groups scanner window.

scan types
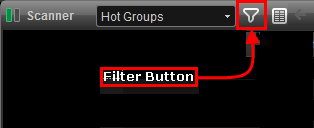
you can access the different scan types by clicking on the filter icon located at the top of the scanner window.
the following scans provide a list of stocks using the following criteria:
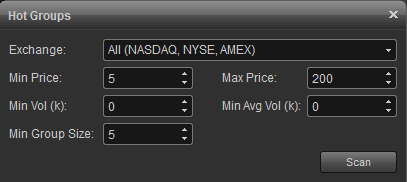
issues
all all stocks
ipo(<2 wks) stocks that have ipo'd within the last 2 weeks
ipo(2 wks - 3 mos) stocks that have ipo'd between 2 weeks and 3 months ago
ipo(3 mos - year) stocks that have ipo'd between 3 months and 1 year ago
min/max price - tells the scan to only consider those stocks that fall between these prices. remember, if the filters eliminate enough stocks to reduce the number of stocks in an industry group below the min group size then that industry group will not be displayed in the hot scan.
min/avg volume - the min volume is used to select stocks whose daily traded volume exceeds the specified value. for example: if min volume is set to 100k, this means a stock has to trade over 100,000 shares to be included in the scan.
The Avg Volume is used to select stocks whose last 20 day average volume exceeds the specified value. For example: If Avg Volume is set to 2000k, this means a stock has to trade over 2,000,000 shares average per day over the last 20 days to be included in the scan. Helpful for weeding out very thinly traded stocks whose movements are not supported by sufficient volume for trading.
scanner properties
right click the scanner window and select properties to access the scanner properties menu which includes the following:
default cell
the default cell menu allows you to specify the font type and size along with a button for bold and italics. there are color settings which include text and background. background #2 is checked if you prefer alternating colors for each row.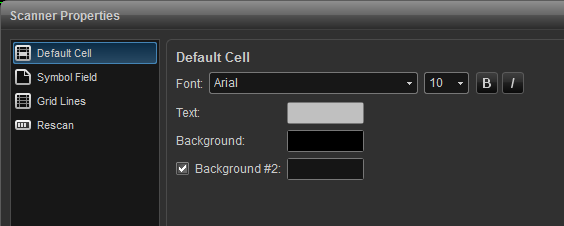
symbol field
change fonts, colors, and toggle between displaying the symbol or description of the listed issues. background #2 is checked if you prefer alternating colors for each row. you can opt to show symbol as description which will display the description vs. the symbol.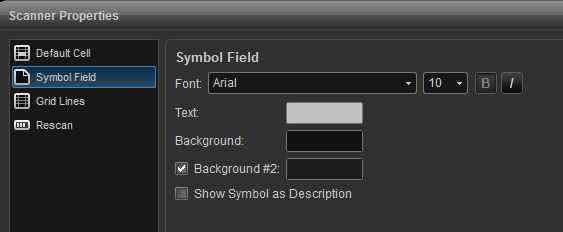
grid lines
use this menu to add vertical and horizontal grid lines and to customize the grid line color. 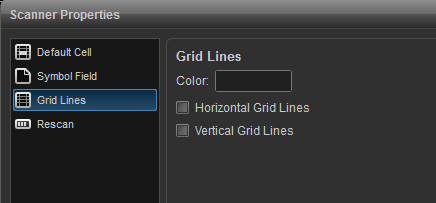
rescan
use this menu to turn on auto refresh. auto refresh forces the database to be re-scanned in the selected interval. 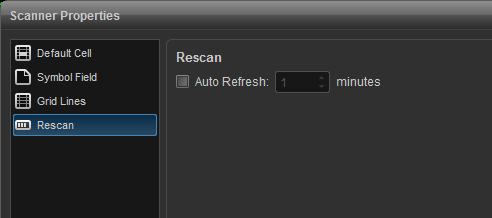
please click on the link below to access the various esignal market scanner strategies.
http://www.esignal.com/education/likepro/strategy/default.asp
*please note that the scanner only scans the market for us stocks.