This article provides an overview for using the Drawing Tools feature in a Chart Window in eSignal. For Chart Window Basics, click here.
Applying drawing tools
Right-click Menu
Line Tool Alerts
Templates
Trend Lines
Trend Line Properties
Manage Drawing Tools
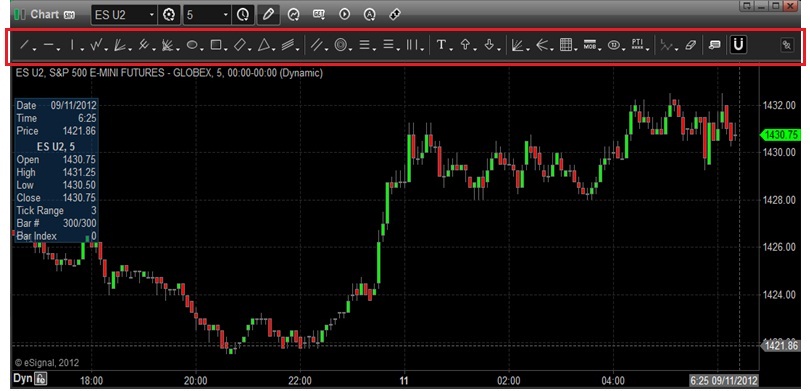
Trend Lines, Text and Fibonacci tools can be accessed via the drawing tools toolbar. Select the drawing tools icon
 to display the drawing tools toolbar. Click the thumbtack icon
  to "Pin" the toolbar on the chart, so it is always displayed on the chart.
Alternatively you can access the Drawing Tools by right-clicking in the Chart window and selecting Insert Drawing Tool. A side menu will appear where you can select the type of line you wish to draw or by using the hot keys that listed by each drawing tool on the menu. If you own the Advanced GET version, other tools in this toolbar and menu (Gann Box, Gann Angle, Time and Price Squares, MOB, TJ's Ellipse, PTI and Localize Elliott Line, etc) are available.

Lock Objects: Studies and lines cannot be moved, when turned on. To select Lock Objects, right-click anywhere in the chart window and select Lock Objects on the menu located in the bottom section:

Lock Text: The position of text on a chart can be locked in place as the chart updates or is scrolled. To lock text into a specific position, right-click on the text and select Lock Position:

Right-Click Menu
Right-clicking on an existing drawing tool will bring up this menu:

Edit: To edit a Drawing Tool on a chart, right-click on it (or double left-click) and select Edit. This will bring up the Edit Chart Dialog Box. Select the tool from the left panel in order to make changes. Each specific tool will have it's unique dialog box. For example, the properties dialog box will allow you to change the color, style, width, change the end type of the trend line, extend it to the left, right, or both and add price ruler information.
 :
:Hide: This function will temporarily remove the drawing tool from the chart. To place the drawing tool back on the chart, right-click on the chart and select Edit and click on the check box for the study (in this case, a Trend Line):

Cut: Will remove the drawing tool and gives you the ability of pasting it in a different location. A keyboard shortcut, Ctrl X,is also available.
Copy: Creates a copy of the drawing tool that you can paste in a different location. A keyboard shortcut, Ctrl C,is also available.
Duplicate: Creates a duplicate image of the drawing tool that you can left-click on and drag to a different location on the chart.
Templates: Allows you create multiple versions of a drawing tool that can be conveniently applied instead of having to edit a tool each time. To create a template, set your new parameters in the Edit Chart dialog box and click the Template button at the bottom of the box. Click Save As... and give the template a name.

To apply the template, right-click on the drawing tool icon you want apply to the chart. In this example, I have created several templates for the Regression Trend drawing tool. By right-clicking the Regression Trend drawing tool, I can select which version I want to apply to the chart.

Remove [Drawing Tool]: Deletes a selected drawing tool from the chart. A drawing tool can also be deleted by left- clicking on it and press the Delete key on the keyboard.
You can choose to remove all the drawing tools from the chart (vs. one at a time) by right-clicking the chart and selecting Remove All Drawing Tools.

Line Tool Alerts
You now have the ability to set alerts based on prices levels displayed by any line tool on the Drawing Tool Bar. With the Ellipse, Rectangle, and Fibonacci Circle, the alert is generated by the boundary line of the shape. So now you can be notified when the price is near the support or resistance levels by lines or by the boundary of a shape. Alerts on You can choose to be alerted with an audio alert, pop-up alert, e-mail alert, or by changing the color of the line for few seconds.
To set up an alert on an existing, draw a trend line on your chart, then right-click the mouse in the chart and click Edit Chart. Select the line tool for which you want to set an alert on. Trend Line appears on the left-hand side of the window to display the Properties and Alerts tabs. Click the Alert tab to set the parameters for the alert. (If you have multiple drawing tools on chart, you can set an alert for each one).
To activate the alerts settings, check the box 'Enable Alert', then enter the number of Min Ticks. For example, for stocks the min tick is 0.01, for futures such as the S&P 500 e-mini is 0.25. This means that if you set the min tick as 4, then the alert will trigger when the price falls within the proximity (.04 for stocks and 1.0 for the S&P 500 e-mini) of the alert price.
Automatic Reactivate: Will reactivate the alert every time it triggers.
Once Per Bar: It will trigger the alert once per bar regardless if the price falls within the alert settings in the same bar.
Note: For Advanced GET users, an Enable Alert on Vertical Lines check box will appear if the Gann Box drawing tool is applied to a chart. 
Alert Action: Here you can select the way how you want to display the alert when it triggers and add a message (comment). It could be by highlighting the line with the color of your choice for certain number of seconds, show a pop-up, play a sound, or send an e-mail and a message which will appear in the alert and in the Alert Log window.
Alerts can now be added to line tools in subcharts for secondary symbols and subcharts for studies (example: MACD)
Trend Lines
 . you can select the type of trend line or select a template (trend line 1, in this example) that you have created by right-clicking on the icon, then the following drop down menu will appear:
Trend Line Properties
If you right-click on a trend line and select Edit, the dialog box for the trend line will appear. Double left-clicking on the trend line will also bring up the Trend Line Properties dialog box:

The first section of the dialog box allows you to edit the formatting parameters of a trend line:

Line Formatting: In this section of dialog box you can edit the Color, Style, Width using the drop down menus to format the line. Unchecking the Extend Left and Extend Right check boxes allows you to have trend line segment. You can then select the End Type from the drop down (highlighted) for one end of the line or both ends.

Horizontal Line
You can now specify whether to draw the line infinitely in both directions or to the or to left of the point where it is applied. You can right-click on the horizontal line and select Edit or right-click any where in the chart and select Edit Chart. Highlight the Horizontal Line you want to edit, and click the dropdown menu next to Drawing Mode:

Infinite: Extends the horizontal line to the right and to the left of the point origin.
Extend Right: Extends it to the right of the point origin.
Extend Left: Extends it to the left of the point origin.
You can create a default trend line or you can create several version of lines and save them as a template as described above in the templates section.
Price Ruler: The second section of the dialog box is set up the trend line as a price ruler. Trend lines have the ability to measure the distance (time and price) and the slope between two anchor points. It can also display a percentage amount to track performance. Check the boxes for Price Distance, Percent Distance, Bar Distance and Slope (Price Distance / Bar Distance) for the items to be displayed (if any). You can set your selection as the default or as a template, if you wish to use different versions.

Manage Drawing Tools
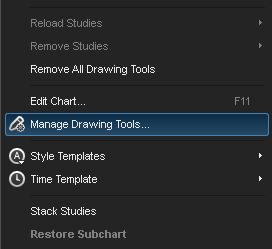
The Manage Drawing Tools feature allows you to keep track of existing lines and drawing tools. Right-click the chart (excluding a drawing tool or study) and select Manage Drawing Tools:

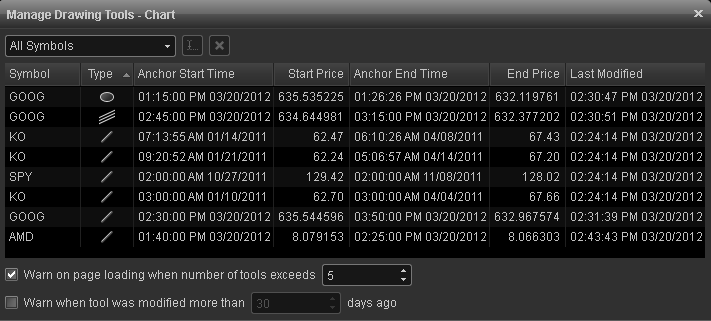
You'll find a list of sortable columns which include Symbol, Type, Anchor Start/End Time, Start/End Price, and Last Modified. In the top left you can choose to display all symbols, current symbol, or all symbols except current.

Right click an existing column header to check or uncheck columns you wish to display or hide. Arrange Columns will autosize the column widths to fit the window.

Towards the bottom of the Manage Drawing Tools menu are two Warning options:
Warn on page loading when number of tools exceeds X - Helps to monitor the max number of drawing tools preset in advance before receiving a warning.
Warn when tool was modified more than X days ago - This can be used to track older line tools that are no longer being used. It's a good idea to monitor and delete line tools that are no longer being used to help free up PC resources.
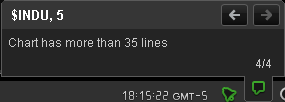
These warnings will display in the bottom right hand corner of the application when triggered.
