The AutoWave is a study that analyzes price swings in terms of Fibonacci price patterns. AutoWave has three components: 1) ZigZag; 2) Existing Patterns; 3) Projected Patterns.
ZigZag
The ZigZag lines are the basis of the AutoWave study; they define the high and low extremes of price swings. These are typically used to help remove noise in active symbols to assist pattern traders such as Elliot Wave or Fibonacci traders. In AutoWave, the minimum distance between each ZigZag peak and valley can be adjusted to make the waves more or less sensitive. Typically, this is done to form fit the ZigZag lines against a issue's natural swing patterns.
The price distance between each zig and zag is included in a small box on each line to easily see the actual underlying movement of each wave. This is important for system traders that have defined rules for validating trends or patterns.
Existing Patterns
With each swing defined via the ZigZag lines, the AutoWave can now perform analysis on those waves. One method for looking at trend retracements and continuations is using Fibonacci ratios. These mathematical values are found all throughout nature and are also often used in financial markets to highlight possible support and resistance levels.
It is commonly accepted that the more often a ratio occurs historically within a symbol, the more likely it is to reoccur. The AutoWave will automatically search the historical patterns in a symbol and show you which have come close to a Fibonacci ratio by highlight them in green.
Projected Patterns
The AutoWave study will automatically display Fibonacci price levels that will satisfy a Fibonacci ratio. This doesn’t mean that price will reach that level, but that resistance or support is likely at that level if the price does approach it. Projected price levels from a high are red and from a low are green.
The AutoWave study will automatically display Fibonacci price levels that will satisfy a Fibonacci ratio. This doesn’t mean that price will reach that level, but that resistance or support is likely at that level if the price does approach it. Projected price levels from a high are red and from a low are green.
Appying the AutoWave Study


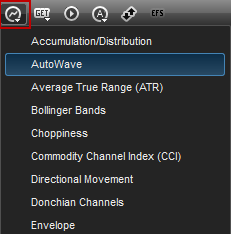
To apply the AutoWave study to a chart, left-click on the Built-in Studies icon and select AutoWave from the drop-down menu.
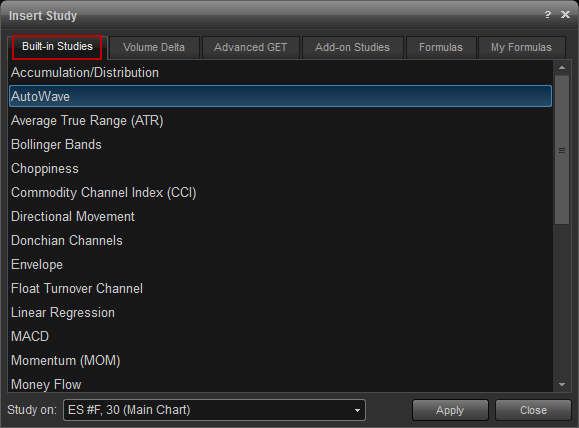
Alternatively, you can right-click on the chart, when the menu appears, left-click on Insert Study, left-click on the Built-in Studies tab and then select AutoWave.
Properties
To display the Properties dialog box, right-click in the chart window and select Edit Chart. Highlight AutoWave and left-click on the Properties tab. Alternatively, you can right right-click on any AutoWave line and select Edit and left-click on the Properties tab.
Bars to left: Sets the numbers bars to the left of the chart window that are used to label the waves that have end points that are visible in the chart window.
Bars to right: Sets the numbers bars to the right of the chart window that are used to label the waves that have end points that are visible in the chart window.
Zigzag
Wave Size: Number that defines a high or low price extreme, by stating the number of surrounding bars on either side that must not be higher or lower than the candidate extreme. Another way to think of it is: Wave Size + 1 is the minimum distance between extremes of the same high or low type.
Subdivide waves: A checkbox on the property page will cause AutoWave to look for additional extremes, in places where there are two extremes of the same high or low type next to each other.
High Extremes: High is the default. Open, Low, Close, (H+L)/2, (H+L+C)/3, (O+H+L+C)/4 are available.
Low Extremes: Low is the default. Open, High, Close, (H+L)/2, (H+L+C)/3, (O+H+L+C)/4 are available.
Draw Zig Zag: Toggles the display of the Zigzag on or off.
Existing Patterns
Draw Existing Patterns: Toggles the display of the Existing Pattern lines on or off.
Filter patterns with Wave Ratio Table: By default, AutoWave shows only the patterns that come close to one of the table ratios. You can disable the Wave Table by unchecking the box below. (This would have the same effect as raising the error tolerance to a high number.)
Error tolerance: Select the amount of leeway in percentage terms to how close to a table ratio that a pattern has to be.
Projected Patterns
Draw Projected Patterns: Puts an absolute limit on the number of projections radiating from a single extreme.
Price Levels: This setting controls how far away the projections may be, as a function of the vertical distance between the leftmost two extremes that define the swing. The default value of 500 would allow Wave Ratio Table entries under 500 to be projected.
Swing Distance: This setting controls how far away the projections may be, as a function of the vertical distance between the leftmost two extremes that define the swing. The default value of 500 would allow Wave Ratio Table entries under 500 to be projected.
Hot Zone: The Hot Zone is a price interval surrounding the rightmost chart price, within which AutoWave will display both projected highs and lows. Above the Hot Zone, only potential tops will be shown, and below, only potential bottoms.
Wave Ratio Table
Allows you to select which ratios are used in labeling the Existing Patterns lines.
Appearance
Select colors, line styles and thickness of lines. To display the Properties dialog box, right-click in the chart window and select Edit Chart. Hightlight AutoWave and left-click on the Appearance tab. Alternatively, you can right right-click on any AutoWave line and select Edit and left-click on the Appearance tab.
