Did you know eSignal supports a variety of tick-based Intervals? Tick, Seconds, Volume, Price Change and Range intervals can all be viewed in the chart.
Note: Tick-based intervals are not available with the Classic subscription.
Tick Interval
Tick charts are based on a specified number of ticks. A 30T interval will create a new bar for every 30 ticks (trades).
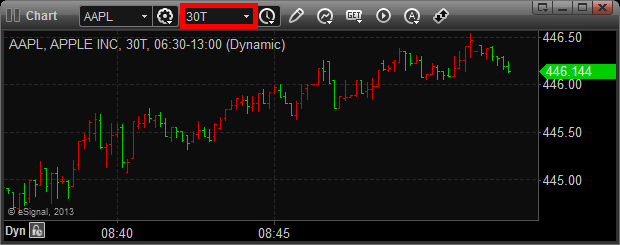
Tick charts are based on a specified number of ticks. A 30T interval will create a new bar for every 30 ticks (trades).

Seconds Interval
This interval uses a specific number of seconds to display data. A 30S interval will create a new bar every 30 seconds.
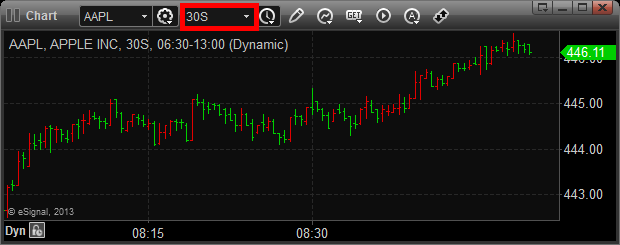
This interval uses a specific number of seconds to display data. A 30S interval will create a new bar every 30 seconds.

Volume Interval
A Volume chart uses volume instead of time to display data. A 500V interval will create a new bar for every 500 shares traded.
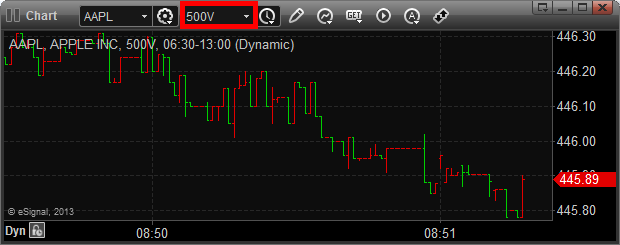
Price Change Interval
This chart type builds bars based on price changes. For a 50P interval, a new bar will be created for every 50 price changes.
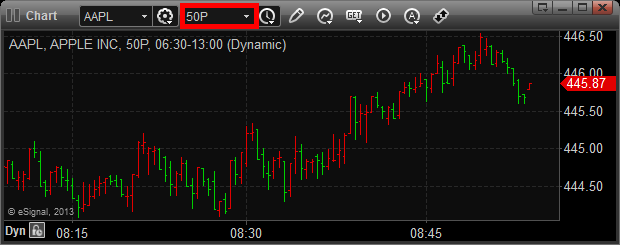
This chart type builds bars based on price changes. For a 50P interval, a new bar will be created for every 50 price changes.

Range Bar Interval
A Range Bar chart creates new bars based on a predetermined price range. For example, to create a range bar chart equal to 1 pt (i.e. $1 for a stock) type 1R in the interval box.
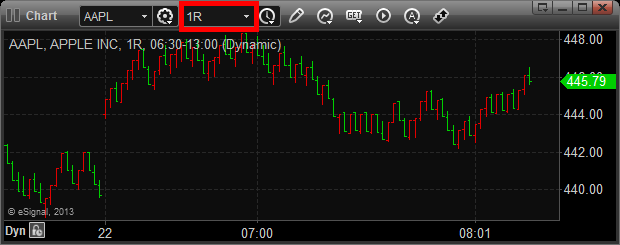
A Range Bar chart creates new bars based on a predetermined price range. For example, to create a range bar chart equal to 1 pt (i.e. $1 for a stock) type 1R in the interval box.
