eSignal - Standard Chart Basics
This article will help the eSignal user to understand how to open and customize an Standard chart window, as well as saving the defaults for new chart windows. The last paragraph in this article contains a link for the Standard Chart Basic video training.
Opening an Standard Chart
From the menu bar, click on File > New > Standard Chart, then click Default Chart (or any of the other types of Standard charts). By clicking Default chart, it will open a default Standard chart window that will look like the one displayed below, which is a Daily chart 6 months.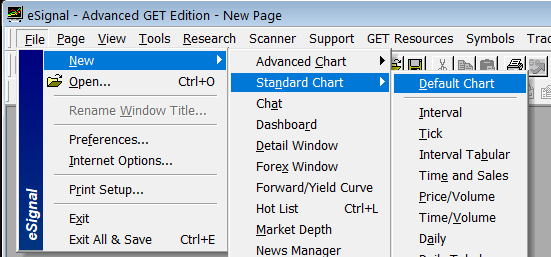
Symbol Box and Symbol List
The symbol Box is the box used to enter the symbols in the chart. It also contains the Symbol List.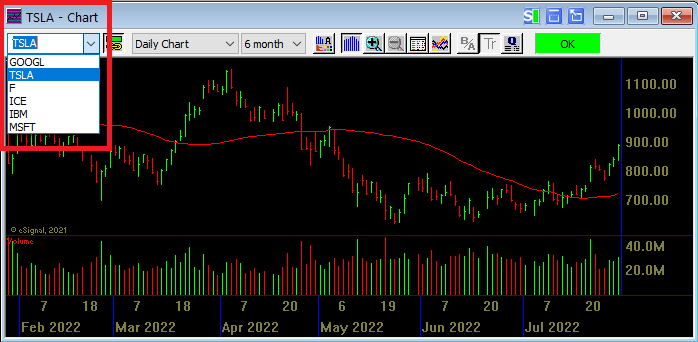
Click here to learn more about the Symbol List.
Standard Chart Properties
There are two ways to access the Standard Chart Properties dialog box. You can click anywhere inside the Standard Chart, then go to the menu bar and click Chart Options, then Properties, or you can click the Properties icon in the chart toolbar. The properties dialog box window will allow the user to change specific chart options. Looking at the figure below, there are seven tabs, one for each type of chart that can be open in the standard chart and one labeled General which contains the chart time settings as well as the Number of Days settings to display a particular number of days.
Chart Information Window
To add or remove the Chart Information window click the 'Info Window' icon in the chart toolbar.
The Chart Information window displays the data for the bar or tick you currently have highlighted.
By default, the Chart Information window will display current information such as the symbol, date, open, high, low, close and the analytics.
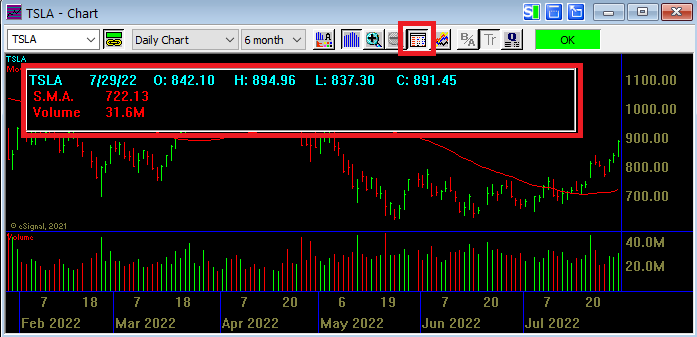
To display data for ticks or specific bars, left-click and hold the mouse in the chart, as you drag the mouse over the bars the values in the Info Window will change. Your mouse will display a plus sign instead of the cursor (arrow).
Chart Analytics
To open the Analytics (Studies) Set-Up dialog box, click the Analytics icon in the chart toolbar.
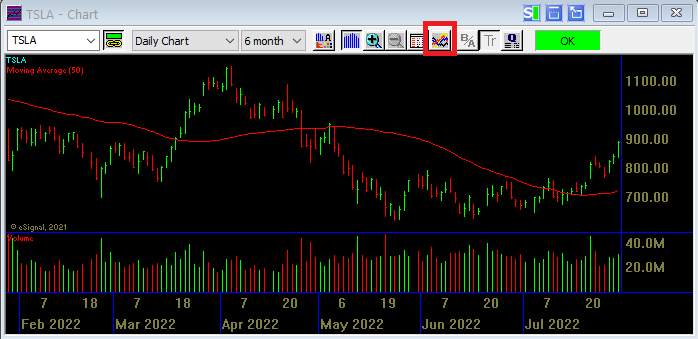
To add analytics, highlight the analytics you wish to add in the "Functions" box, then click "Add>>". The analytic will display in the "Selected" box and below the two boxes you will find the settings for color and parameters.
To remove analytics, higlight the analytic you will like to remove, then click "Remove".
To edit analytics, highlight the analytic in the Selected box to display the settings for color and parameters.
Quote Area
To add the Quote Area to the Standard chart window, click the Quote Area icon in the chart toolbar.
The Quote Area displays information such as Last Price, Change, Open, High, Low, Close, and other fields.
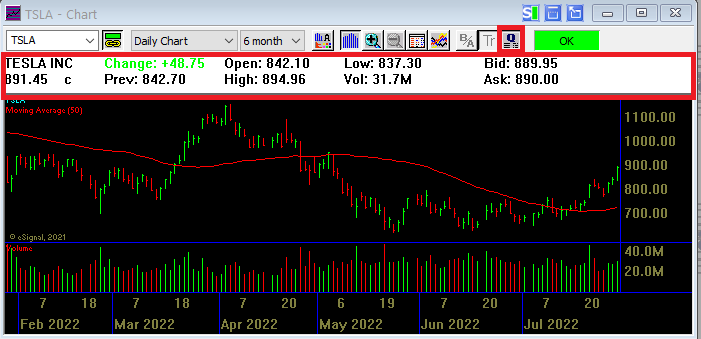
To add more fields to the Quote Area, double click the mouse inside the quote area, it will open the window Field Select.
Hold down the Left mouse button over the field you will like to add and drag the field to the Quote Area, release the mouse once it is in an empty spot.