advanced charting - tick chart, tick bar chart, seconds bar, volume bar & price change bar charts
esignal supports a variety of different tick chart options. when entering a symbol into an advanced chart, you use the interval box to select which of the 4 types of tick charts you want.
tick chart
tick bar chart
seconds bar chart
volume bar chart
price change bar chart
range bar chart
expected download sizes
tick chart
a tick bar chart is an interval chart that uses number of ticks, instead of time, to display the data. if you enter t or 1t, you'll get a pure tick chart, where each interval of measurement is a single trade or tick.
setting up a tick chart
open the symbol entry field by pressing the comma key (,) on your keyboard or simply start typing a new symbol. using the interval box, enter the appropriate code for example to get a tick chart you will have to enter a t in the interval box, then click ok.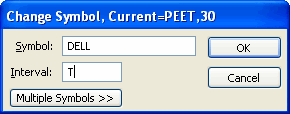
tick bar chart
a tick bar chart will build bar charts based on an specified number of ticks. you can build tick bars with any increment you chose.
setting up a tick bar chart
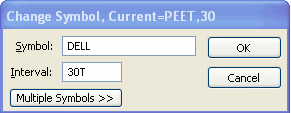
open the symbol entry field by pressing the comma key (,) on your keyboard or simply start typing a new symbol. using the interval box, enter the appropriate code. for example, to create a 30 tick bar chart (meaning you want 30 ticks to form each bar) you will have to enter 30t in the interval box.
seconds bar chart:
a seconds bar chart is an interval chart that uses the number of seconds instead of number of minutes to display the data.
setting up a seconds bar chart
open the symbol entry field by pressing the comma key (,) on your keyboard or simply start typing a new symbol. using the interval box, enter the appropriate code.
for example, to create a 30 seconds bar chart (meaning you want 30 seconds of data to form each bar) you will have to enter 30s in the interval box 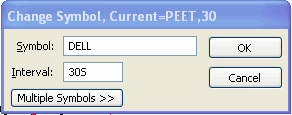
volume bar chart:
a volume bar chart is an interval chart that uses volume, instead of time, to display the data. instead of using 1 minute or 60 seconds per bar, you can enter 500 shares or contracts per bar.
setting up a volume bar chart
open the symbol entry field by pressing the comma key (,) on your keyboard or simply start typing a new symbol. using the interval box, enter the appropriate code. for example, to create a 1000 contracts per bar bar chart (meaning you want the bar to fill with 1000 contracts or shares before starting a new bar ) you will have to enter 1000v. 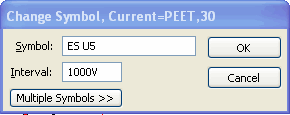
for any number of shares traded higher than the specified interval, the trade will be split among multiple volume bars. for example; say you enter 1000v. then trades totalling 950 shares start building to make-up the current bar when a 200 share trade comes in. 50 of that 200 share trade will complete the current bar and the remaining 150 shares will begin a new bar. these are called "true volume bars".
price change bar chart:
a price change bar chart is an interval chart that uses changes in price, instead of time, to display the data. instead of using a 1 minute chart, you might want 10 price changes per bar. only a price change counts in this type of bar chart.
setting up a price change bar chart
open the symbol entry field by pressing the comma key (,) on your keyboard or simply start typing a new symbol. using the interval box, enter the appropriate code. for example, if there were, in order, 3 trades at 9.25, 2 trades at 9.50, and then 7 trades at 9.25 again, then 3 price changes have occurred. once the selected number of price changes are reached, the current bar is closed out and a new bar is created. to set-up a 50 price change bar, you will have to enter 50p in the interval box.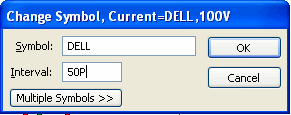
range bar chart
a range bar chart is a type of tick chart that creates new bars based on a predetermined price range. this range is set by the user to calculate the difference between the high and low value for each bar. the bar will continue to build as long as this high/low range is less than or equal to the user defined range. once a trade occurs outside this range, a new bar is formed and the calculation resets and continues. for example, if you set a $1 range for a non-volatile stock, if the trading activity never expands beyond $1 (i.e. a trading range of 25.50 to 25.80), then you'd only paint one bar for that activity. note: range bar charts are available with esignal version 10.0 or higher.
setting up a range bar chart
open the symbol entry field by pressing the comma key (,) on your keyboard or simply start typing a new symbol. in the interval field, enter the appropriate code. for example, to create a range bar chart equal to 1 pt (i.e. $1 for a stock) you enter 1r in the interval box. for smaller ranges, you can use values such as .5r or .25r. for larger ranges, enter values like 3r or 5r. the larger the range, the fewer bars you'll create unless the instrument is highly volatile. 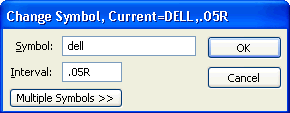
expected download sizes when using tick charts
when you initially make a request for a tick chart, the amount of data you'll download varies by the symbol you choose, the time of day you access our servers ( meaning intraday or after market ) and general market volatility. each example below assumes one days worth of ticks, downloaded at the end of a fairly typical trading day. you can use these as a guide to compare to the symbols you are tracking.
| Heavily Traded Example | Active E-mini Contract | 11MB |
| Medium Traded Example | NYSE Stock GE | 3.2MB |
| Lightly Traded Example | NYSE Stock ZLC | 480K |
Are Spreads available for Tick Charts?
In the Advanced Charts, tick based intervals (i.e. second bars, range bars, volume bars, etc.) These tick bars are created on the desktop so we've been wary about over-working the desktop in light of the spike in market volumes, freezing/performance issues, etc.