cyclePack by Divergence Software, Inc is a unique collection of cycle-analysis indicators. The cyclePack by Divergence Software, Inc indicators use state-of-the-art digital signal processing (DSP) techniques to extract the cycles that exist in your financial data and to gauge their significance. This information is then used to make forecasts as to how the security you are charting is likely to behave over the next several bars (or longer). While we would agree that there is no way to predict the future, the value provided by the cycle analysis process is that it can highlight likely short-term turning points as well as provide an indication of future market direction.
cyclePack by Divergence Software, Inc consists of four indicators that perform slightly different tasks,
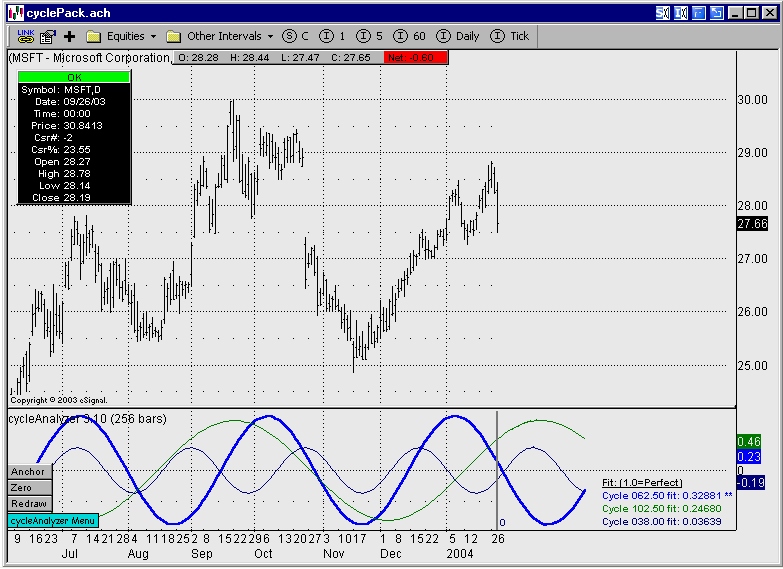
CycleAnalyzer
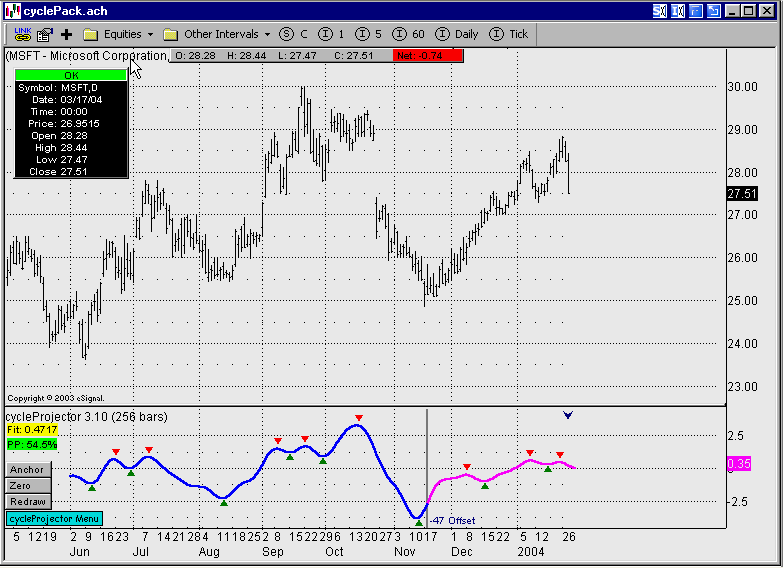
CycleProjector
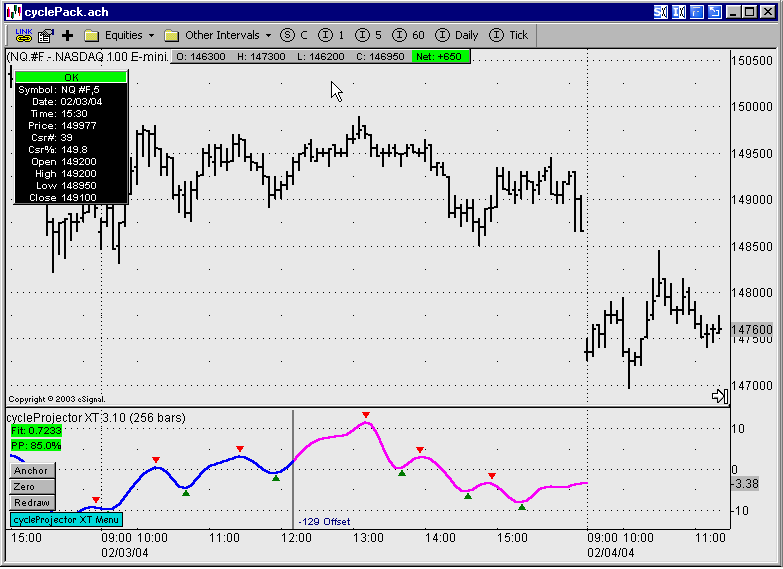
CycleProjectorXT
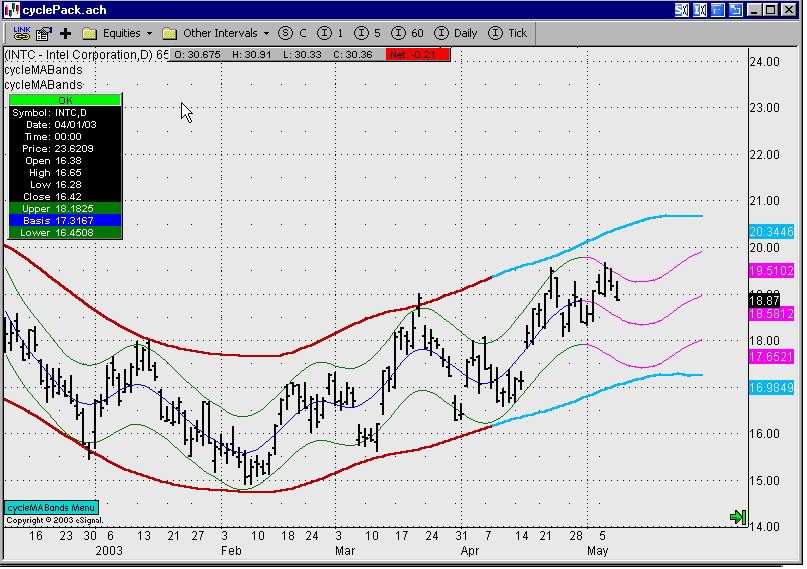
cyclemabands
cycleanalyzer
Once the cycles are displayed, cycleAnalyzer will highlight the cycle that is the most closely correlated with recent price action. In many cases, the best correlated cycle is not the strongest ('dominant') cycle and this is useful information to have. Lastly, cycleAnalyzer will calculate and assign a fitness value to each of the displayed cycles. This fitness value represents the degree (on a scale from 0 to 1.0) to which the individual cycle tracks with recent price action.
cycleprojector
As the name suggests, the cycleProjector indicator projects future price action based upon the cycles that are present in the existing price data. cycleProjector takes a snapshot of the price action at a user-selected point in time (generally the most recent price) and, through a variety of filtering and spectrum analysis techniques, determines all of the cycles present in the price data. After evaluating each cycle to determine consistency, phase and amplitude the cycleProjector indicator creates a synthetic time series based solely on the cyclical content and projects this synthetic times series both backwards and forward in time. The 'fit' of the historical synthetic time series back-plot is used to determine how comfortable you are with the synthetic time series projection that extends into the future.
Just as with the cycleAnalyzer indicator, you have a high degree of control over which existing cycles are used to create the projection and you can easily offset the study back in time to get a feel for how accurate the projections have been on a historical basis.
cycleprojectorxt
cycleProjectorXT provides the same basic functionality as the regular cycleProjector indicator, however, performs a much more in-depth cycle analysis of the price data and, as such, can often provide a much more accurate projection. The impact of the additional analysis is that cycleProjectorXT takes more time to perform its function and may not be suitable for use in all situations.
If you trade on short intraday intervals (e.g., 5-min or less) you will probably be better served by the standard cycleProjector. When using longer intervals you should at least experiment with cycleProjectorXT as it may provide better results.
note that because of the different approach taken in the analysis phase, cycleprojectorxt will sometimes identify cycles that cycleprojector will not.typically, the two indicators will be in agreement but there will be times when cycleprojectorxt, because of the additional detail that it uncovers, will present a significantly different projection.
cyclemabands
The cycleMABands indicator makes the creation of offset moving average channels (aka Hurst Channels) a snap. The concept of using nested envelopes to help visualize the nature of price motion was popularized by JM Hurst in his 1970 book entitled The Magic of Stock Transaction Timing. He also authored a full-length course on cyclical analysis and on how to apply it to actual trading.
NOTE: Please visit the following link for more infomartion about the cyclePack by Divergence Software, Inc indicators, chart controls and Usage: http://www.sr-analyst.com/cyclePackHelp/cyclePack.html
Support:
All support issues are handled via email. Address any questions or support issues to support@sr-analyst.com. Alternatively, you can post your questions in the cyclePack by Divergence Software, Inc forum on our Support Forums. In either case, we will do our best to get your questions answered within 24 hours.
cyclePack by Divergence Software, Inc requires eSignal Version 7.5 (Build 628) or newer to operate. If you are running an earlier version of the eSignal product, please upgrade to the current eSignal release before you attempt to subscribe to the cyclePack by Divergence Software, Inc indicators.
PRICING:
The Cost of the package is $30.00 per month.