esignal 10.5 - new features
we're excited to announce the release of esignal 10.5, our biggest release of the 10 series. there's many new and robust features with this release such as extended intraday data, hot lists, sector lists and more. in addition, key performance improvements have been made for multi-core systems. upgrade to this version for free by visiting our download page.
click here to watch a video that provides an overview of the new 10.5 features. included in this new version are the following enhancements and features:
extended intraday history
we have extended our available historical data in esignal 10.5. this dramatically increases the amount of available intraday data way beyond the previous limits. this new service allows you to access 10 years of minute-based bar data for north american equities and indexes, and 2+ years of north american, european and asian futures, forex and treasuries.
this add on service is priced at $10 / month.
extended intraday history allows for greater precision for our back testing feature where large amounts of historical data to track the performance of their strategies across all types of market patterns and conditions. additionally, support and resistance lines can now be established with a greater degree of accuracy, given that the recent market contraction has pulled back into levels not seen in many years.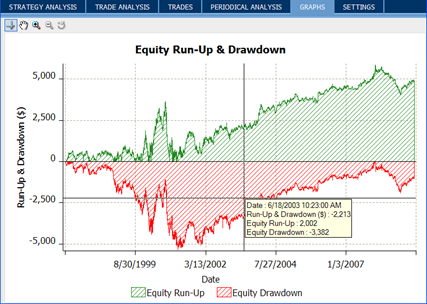
hot lists
new to esignal 10.5 are hot lists, powerful pre-built scans that look through the markets to identify the best trading opportunities and update them automatically every 30 seconds. there are the traditional gainers, losers and volume lists here but also unique scans, such as unusual volume, most volatile and trade rate hot lists, the last of which displays the fastest-trading stocks in the previous minute. this allows a momentum trader to see what is moving right now and react accordingly.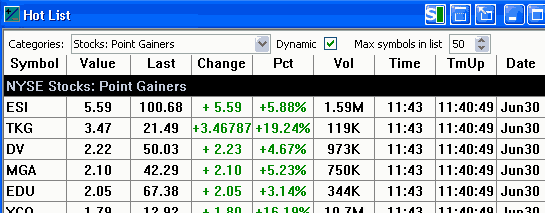
sector lists
the ability to list what symbols are in specific sectors is a powerful way to create specialized watch lists; this can now be done in esignal 10.5 with just a few clicks. much like an autolist, the new sector lists will insert symbols into a quote window for additional sorting and analysis.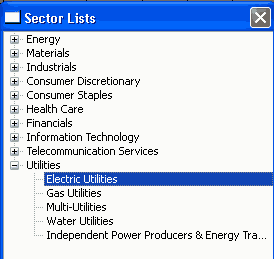
new data fields
in addition to adding numerous lists, we’re also adding 50+ new data fields, such as short interest, float, 12 month % total return, % insider owned, 200-day moving average and many more. for a complete list of available field headers click here.
global portfolio window
the portfolio window has long been a staple for esignal clients wanting to track both the short- and long-term performance of their accounts. from the esignal pro side, money managers will often have multiple client accounts spread across multiple portfolio windows. in esignal 10.5, there is now a way to compare the totals of multiple portfolio windows. the global portfolio window can be accessed from the view menu on the main toolbar: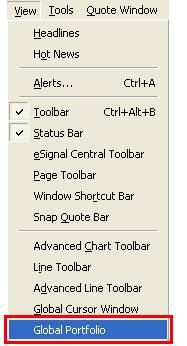
this window will automatically tally all the open portfolios within your page: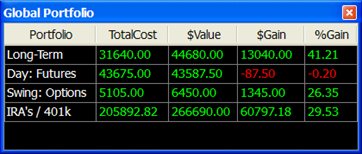
shared symbol lists
esignal can now tap into a new server that saves symbol lists remotely. this enables users to keep synchronized lists of stocks, futures, etc. from one page to another page or even from one pc to another. for instance, you could research your watchlist of symbols at night at your home pc and then have those same symbols on your work pc the following morning. managing these lists is done via the quote window menu.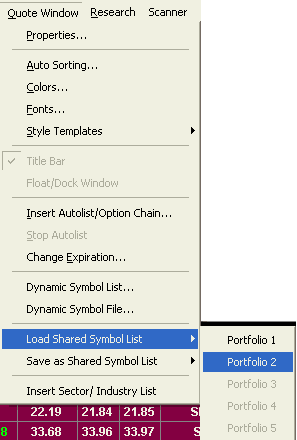
we are also working toward migrating many of our other products into this same server technology so that those using our wireless product, quotrek, can synchronize their symbol lists between the pc and their mobile devices.
forward / yield curves
this window type is used by futures traders and broad market analysts to look at comparative data across multiple futures contracts. the yield curve is typically used to verify the "shape" of the economy…quite literally, actually. if a normal yield curve is present, long-term investors are rewarded with a higher rate of return, and short-term bonds will be a lower yield. when an inverted yield curve is present (higher yields for near-term), the market at large is in an unusual state, and a cautionary approach when investing is warranted. to access the yield curve users must subscribe to bonds data (for example govpx).
forward curve charts provide the user with the ability to view pricing on forward contracts for commodities. forward curves can act as unbiased predictors and allow the user to better see where the market is trending.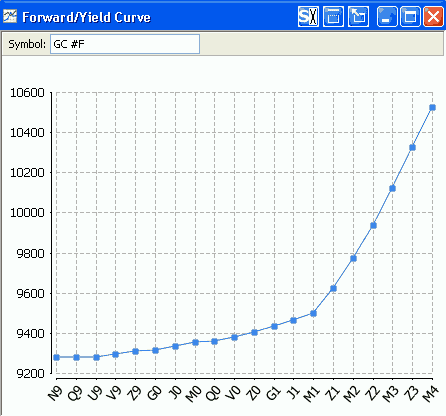
snap quote bar
one of simplest ideas turns out to be one of the more useful…the snap quote bar displays the quote for the symbol you type into it. it’s treated much like a standard toolbar and can be placed along the top or bottom of esignal. it can even be free-floating to be put anywhere on your computer’s display.
the data fields can also be fully customized so that the exact data you want to be displayed is there at your fingertips. in addition, the symbol linking box is fully functional, allowing you to type a symbol into multiple windows at the same time you are getting a quote.
renaming windows
esignal’s layout feature has allowed the renaming of windows for a long, long time…even before the "e" was added to esignal. when pages were introduced, one of the items of contention was that the windows themselves couldn’t be given a custom name to identify them in a unique way; that all changes with esignal 10.5. to assign a name to any window within your workspace click file, rename window title.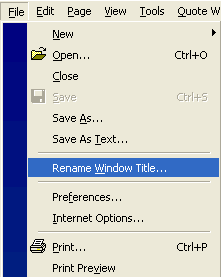
style templates for all windows
all windows within esignal now have the ability to save their settings as different style templates. this enables you to take a specific setup of colors, fonts, fields, etc. and apply it to other existing windows without having to repeat the same setup process for each window.
eSignal 10.5 - New Features
ICE Data Services -