This tool allows you to move to a previous point in time to simulate Real-time trading. It lets you test your formulas and strategies using historical data played back in real-time. You can make adjustments to a custom formula or change the set of indicators you're using and then just go back and replay the data again. You can then watch how the indicators react and see if expected trends play out as the chart steps forward. This helps you fine tune everything to be ready for the next day of trading.
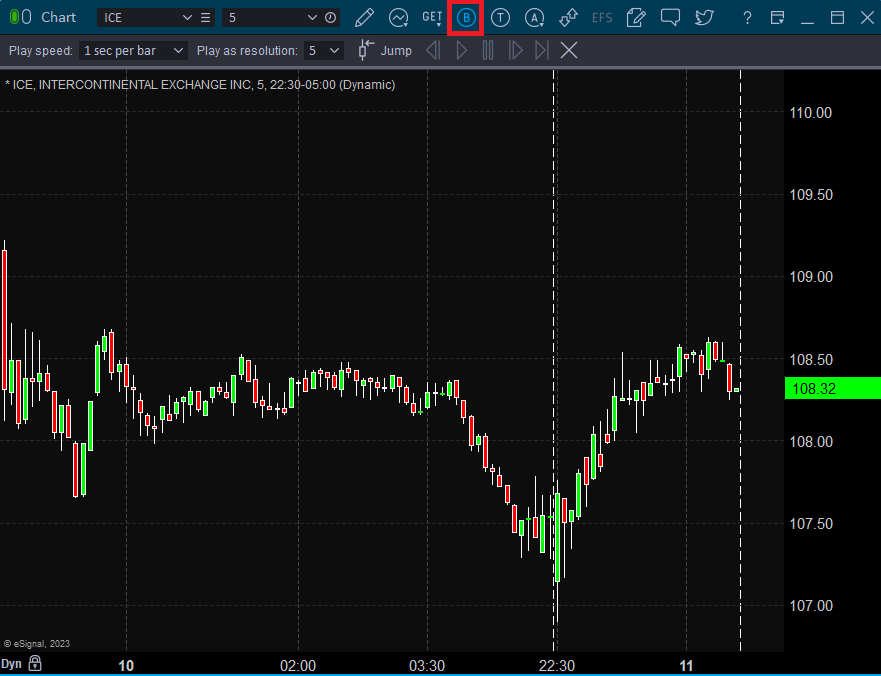
To access the Bar Replay, select the icon (highlighted in red below) located on the title bar of the Chart window.

Once the bar replay menu is visible, click Jump. Your cursor will change to a smaller crosshair with a small vertical line. Left-click towards the left side of the chart to determine your starting point. Continue left-clicking until you reach your desired starting point. An alternate method for determining your start point would be to scroll back on the chart by pressing Control+Left Arrow on your keyboard.
Bar Replay Menu Items

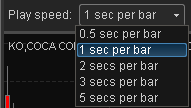
The "Play speed" dropdown allows you to speed up or slow down the speed at which the bars will be replayed. Choose .5 sec per bar for the fastest replay, 5 secs per bar for the slowest, etc.

The new "Play as resolution" dropdown menu enables traders to look at a higher interval, while replaying the data at a lower interval. For example, in a 15-minute chart, a 3-minute resolution is selected. In the background, the program will download 3-minute bars, and, as it replays the 15-minute bars, they will update five times each (once for each 3-minute period). This simulates real-time market updates by forming the bar periodically instead of all at once.

 |
The Jump button is used to select the starting point for Bar Replay. |
 |
The Go Back button will subtract one bar of data from the data set. (back one bar). |
 |
The Replay button begins the playback mode. Once selected the bars will begin to play based on the interval as well as the Play speed that's been selected. |
 |
The Go Forward button will add one bar to the chart (forward one bar). |
 |
The Pause button will only be selectable when the Play button is pressed. Use this button to pause the bar replay. |
 |
The Go To Real Time Chart button will jump to the current bar on the chart. You will still be in Replay mode where you can subtract or jump to a previous point. |
 |
The Stop Bar Replay button allows you to exit Bar Replay mode. The chart will move to the current bar and real time data will start to display. |
|
How do I stop the Bar Replay mode? There are a few things you can do. One option is to click on the Pause button. This will automatically stop the data. You can then click the play button again to continue. Another option is to click on the Go to a real time chart button. This will take you back to the real time chart. Finally, you could use the Stop Bar Replay button to exit this mode.
Can I use Formulas and Studies with Bar Replay? You can at any time add or remove a study or formula when in replay mode. This is true even when you click the Play button. All studies and formulas will calculate when a bar is either subtracted, added, or when using the Jump button.
Can I use Drawing Tools with Bar Replay? Drawing tools will react normally in Replay Mode. If you subtract a bar from the data set that a drawing tool was drawn on, the line will stay on the chart where it was originally drawn from. Lines are not removed once they are placed on the chart, unless you choose to remove them.
Can I manually scroll during Replay mode? Yes, during Bar Replay, you can still use the Go Forward, and Go Back, buttons to add/subtract bars from the data set. This will not interrupt the Bar Replay.
Can I use Bar Replay with more than one symbol on the chart? Bar Replay Mode is limited to one symbol at a time. If more than 1 symbol is added, Bar Replay will be greyed out.


