eSignal 10.6 - Symbol and Interval Linking
Explanation of Icons
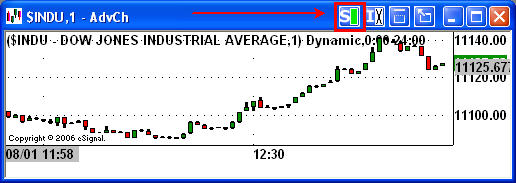
On the eSignal title bar, each window has a link button that can allow you to link by symbol or by interval. You’ll see a row of icons similar to this:
Advanced Chart - ![]()
Quote Window - ![]()
Options Window - 
The "S" stands for Symbol Linking while the "I" is used for Interval Linking (Note: Interval Linking is available with Advanced Charts only). Next you'll find the icons for the hide title bar  and pop-out window
  features.
Symbol Link 
The Symbol Link feature allows you to link two or more windows together. Once the symbol link has been activated, a symbol change in one window will be automatically reflected in all of windows that have been linked.
To link a Quote Window together with a Chart, click on the "S" icon in the Quote Window and select a color. In the example below, 'Green' has been chosen (to disable the link feature, select no symbol link).

Next, go to an existing chart or create a new one (File, New, Advanced Chart). On the Chart, click on the "S" icon and choose the same color from the Quote window (i.e. Green).

Both windows have now been linked. Each time you click on a new symbol in the Quote Window, the symbol will be automatically updated on the Chart. Conversely, if you change a symbol in the chart, the symbol will be highlighted by the cursor in the Quote Window
Interval Link 
Interval Link makes it possible to link two or more Advanced Charts together by interval. Once the Interval Link has been activated, interval changes can be easily applied across multiple charts.
Here's how it works:
On the first chart, make sure the symbol link is disabled, then click the "I" icon and select a color. In the example below, Blue has been chosen on a chart of Dow Industrial index.
Repeat the procedure on the next Advaned Chart for the Nasdaq Composite (i.e. click the "I" icon and select the same color). Once Interval Link has been set, changes in interval (such as going from a daily to a 5 minute interval) can be easily applied to multiple charts.

Link to All 
You can have multiple windows and window types (portfolio, chart, quote, etc) linked together in your workspace. This allows for the linking of multiple groups together using different color codes. The Link to All feature was designed to allow a window to receive all symbol changes from any other window that has symbol linking activated --regardless of the color selected. Additionally, the all link feature sends any symbol change from the window using the all link feature to all other windows using any link color. Please note that this feature is available for both symbol and interval linking.
To enable the all link feature, click on the "S" in the top right corner of your window. Click "Link to All". a small "a" will now appear next to the "S" which indicates that the all link feature has been enabled and is linked to all other windows.
Regional Link (Market Depth) 
The market depth window allows you to view regional data for NYSE and NYSE American stocks. To create a new Market Depth Window, click File, New, Market Depth. On the Title Bar, click the  icon and select a color (yellow is used in the sample below). Bring up a chart, click on the "S" icon and choose the same color. With regional linking enabled, clicking on a region (i.e. NYSE, MSE, PSE, etc) in the Market Depth window (listed under MMID column) will send the symbol to any chart linked with the same color.
Note: Regional linking will only work with interval charts.
Options Link (Options Window) 
The options link feature allows you to send symbols from the option window directly into an Advanced Chart. In order to use the options link feature you must be subscribed to OPRA as well as the exchange of the underlying option (i.e. NYSE, NYSE American or Nasdaq). In the Options Window, click on the options link icon ( ) and select a color. Orange is used in the sample below. bring up a chart, click on the "S" icon and choose the same color. Now that the two windows are linked, clicking on a put or call in the options window will send that symbol directly into the Advanced Chart.
