Overview
Volume at Price provides a look at the distribution of trades across a trading period by taking volume and comparing it against price. The Volume at Price study automatically adjusts based on the data that is loaded into the chart view as you scroll through a chart, backward or forward, or compress or expand the bars. This lets you see where the bulk of the trading has taken place historically which may indicate current support or resistance levels based on volume.
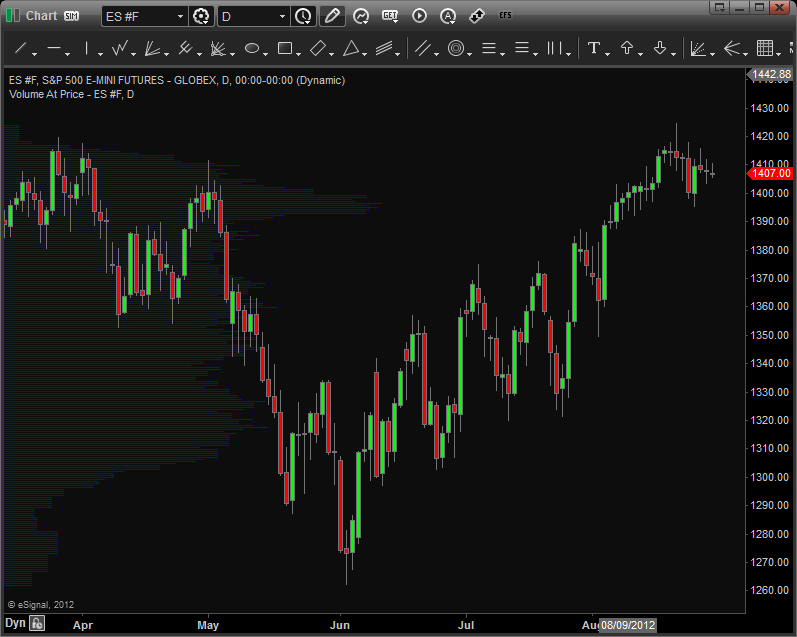
Volume at Price provides a look at the distribution of trades across a trading period by taking volume and comparing it against price. The Volume at Price study automatically adjusts based on the data that is loaded into the chart view as you scroll through a chart, backward or forward, or compress or expand the bars. This lets you see where the bulk of the trading has taken place historically which may indicate current support or resistance levels based on volume.
Applying Volume At Price on a Chart
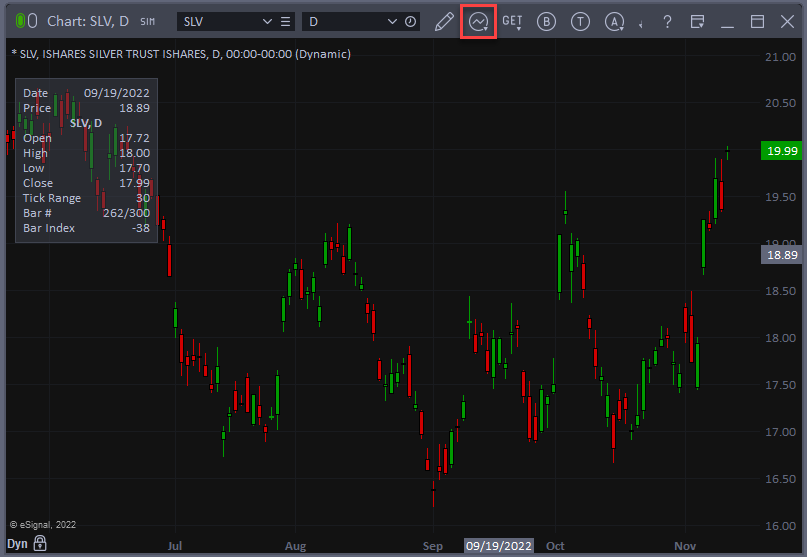
To apply the Volume At Price study to a chart, left-click on the Built-in Studies icon. Select Volume At Price from the dropdown menu.
Alternatively, you can also right-click on the chart, when the menu appears, left-click on Insert Study, left-click on the Built-in Studies tab and then select Volume At Price.
Properties
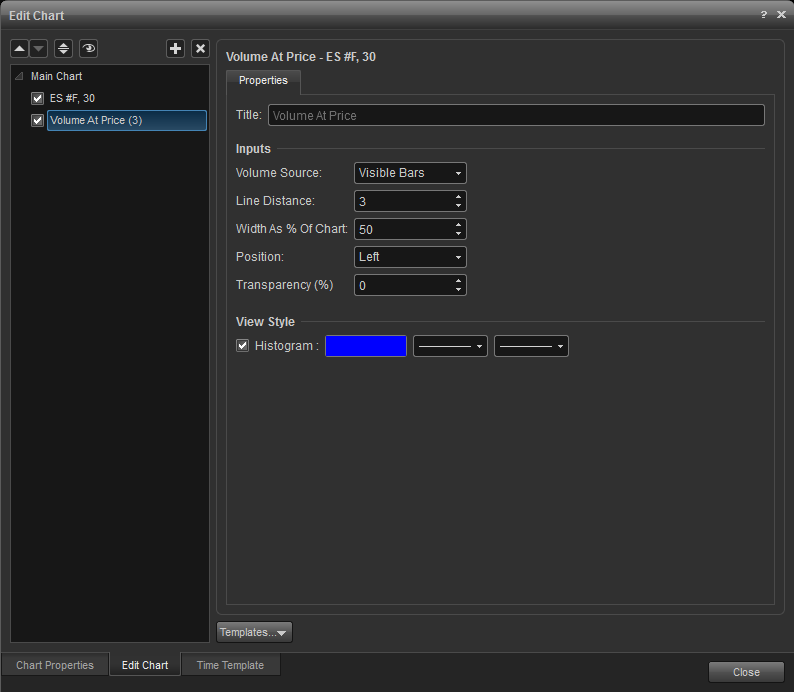
To edit the study properties, right-click anywhere in the chart and select Edit Chart. Highlight Volume At Price. Click Close when finished.
Volume Source: Select the source that the study will use as the basis for the study: visible bars, current session bars, or all bars.
Line Distance: Adjust the distance between volume bars.
Width As % Of Chart: Selects the width of the study display compared to the width of the chart.
Position: Positions the study on either the left side of the chart or the right side.
Transparency: Adjusts the transparency of the display of the study.
View Style: Toggles the display of the study on or off, the color of the study bars, and their style.