eSignal 12 - Float Turnover Channel
Overview

The Float Turnover Channel study displays a shaded channel which represents the time it took for the volume of trades to equal the entire public float of the symbol. This study is applicable to Equities only (specifically those with Float data). Additionally, the Float Turnover Channel only works on daily intervals or higher.
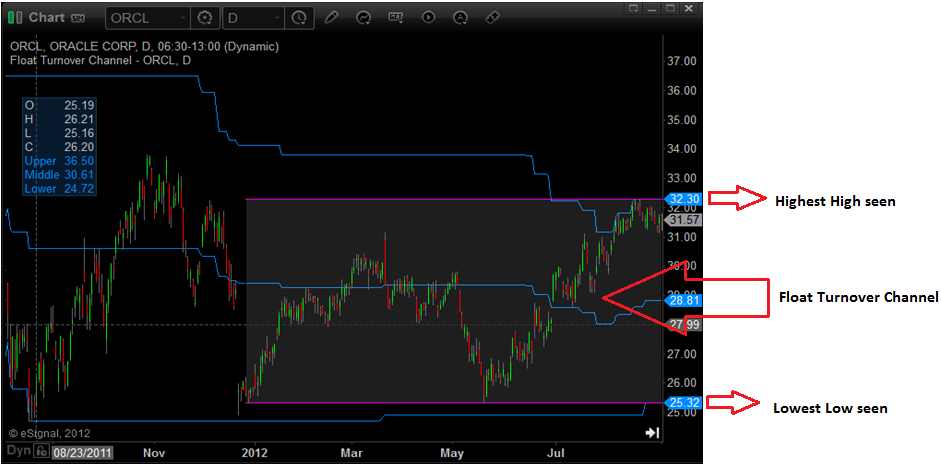
The upper line of the channel represents the highest high seen during the time, and the lower line represents the lowest low seen during the time. Float turnovers are shown on the charts as a gray rectangle with two pink edge lines. The rectangle changes from day to day like a moving average and is known as the float turnover box or float box. The following picture gives an example of what this looks like on a chart with the default settings.

The blue lines are the historic values of the Float Turnover Channel. The Upper and Lower channel lines display where the channel lines were in the past. The Middle line is the mid-point.
Applying the Float Turnover Chanel
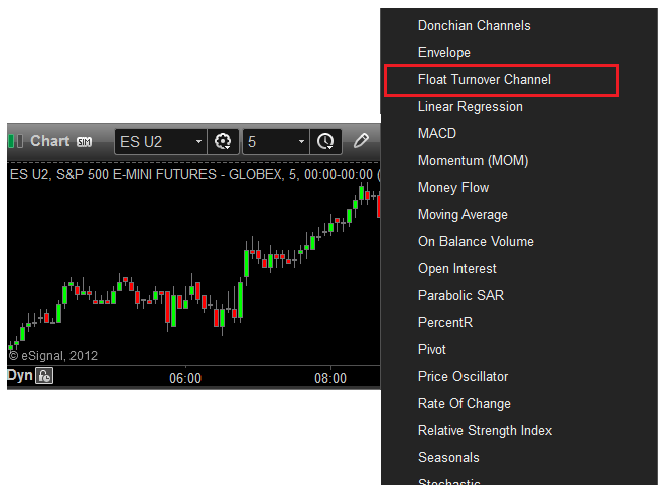
To apply the Float turnover Channel study to a chart, left-click the Built-In Studies icon and then click over the Float Turnover Channel from the drop-down menu.

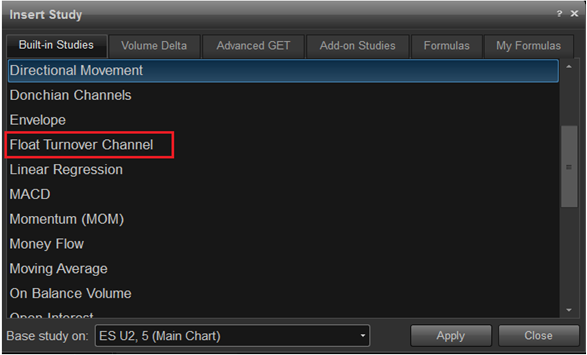
Alternatively, you can also right-click on the chart, when the menu appears, left-click on Insert Study, left-click on the Built-In Studies tab and then select Float Turnover channel.

Properties
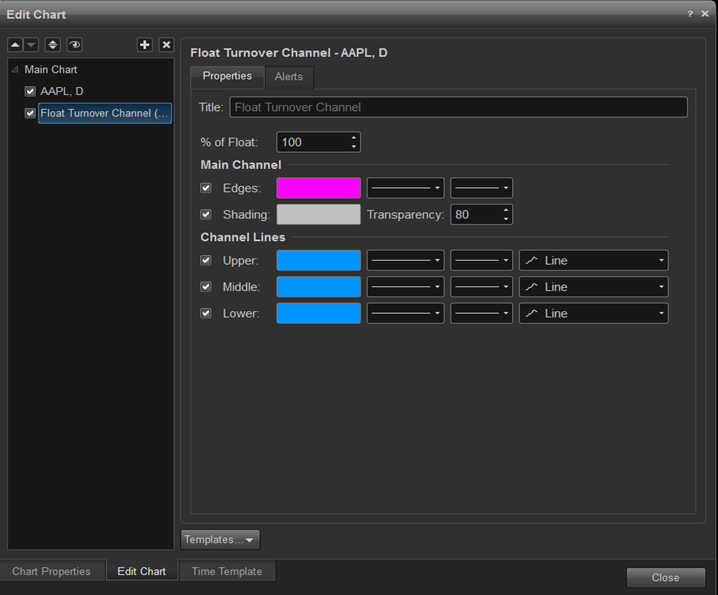
You can change the appearance of the study or turn on/off features of the study using the Edit Charts.
To display the Properties dialog box, right-click in the chart window and select Edit Chart. Highlight 'Float Turnover Channel' and left-click on the Properties tab. Alternatively another way to access the chart properties is by right-clicking the mouse on the study lines and clicking Edit.

Float turnovers refers to any time frame on the chart in which the cumulative volume equals the number of shares in the floating supply.