Overview
The Heikin-Ashi (means "average bar" in Japanese) chart type is very similar to the Candlestick chart type except that it also uses the previous candle's data in the calculation of the current candle. Candlestick charts are based only the current candle's data. Many traders prefer Heikin-Ashi Charts over Candlesticks because it filters market "noise" better.
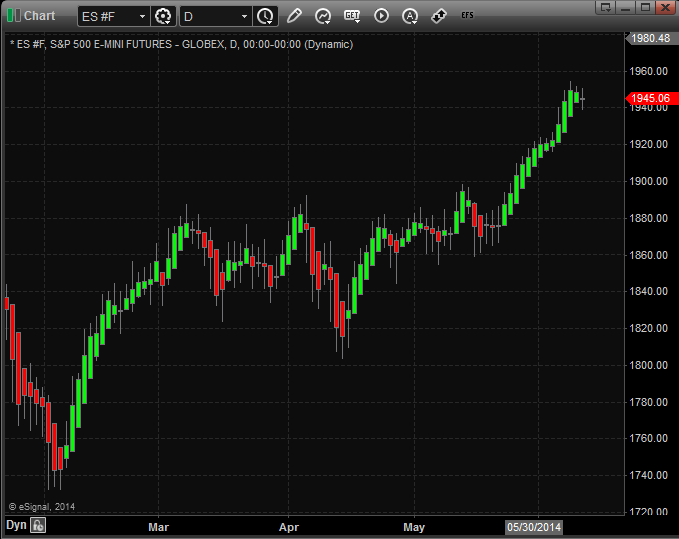
Below is a example of the difference when displaying a daily chart of ES #F. You can see the Heikin-Ashi chart does a better job of the displaying up (green candles) trends or down trends (red candles).
Heikin-Ashi Chart:

Candlestick Chart:

Calculation of Heikin-Ashi Candles
Uses the current and previous bar data:
Uses the current and previous bar data:
HAClose = (Open + High + Low + Close) / 4
HAOpen = (Open of Previous Bar + Close of Previous Bar) / 2
High = Highest value of either High, HAOpen or HAClose
Low = Lowest value of either Low, HAOpen or HAClose
HAOpen = (Open of Previous Bar + Close of Previous Bar) / 2
High = Highest value of either High, HAOpen or HAClose
Low = Lowest value of either Low, HAOpen or HAClose
Opening a Heikin-Ashi Chart
To open a Heikin-Ashi Chart in a new Chart window, select New from the menu bar and then select Chart. A keyboard shortcut (Ctrl+1) is also available.
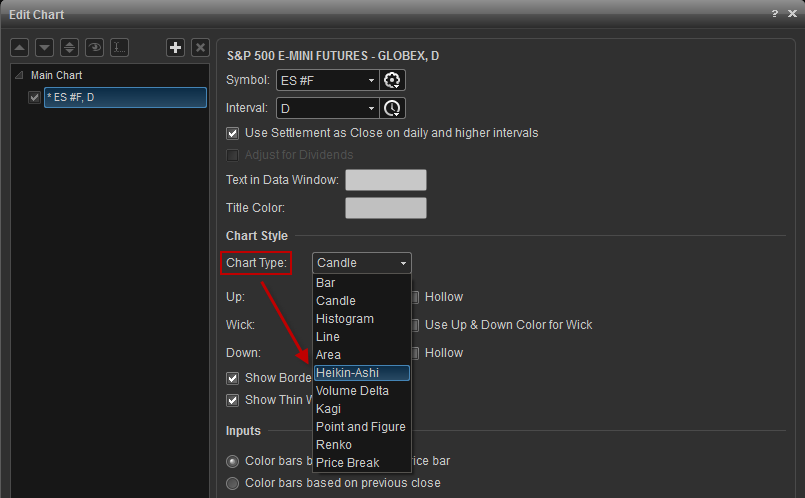
This will open a New Chart window, to change the chart type right click on the Chart window and select Edit Chart. Inside the Edit Chart window, select Heiken-Ashi from the Chart Type drop down menu.

To change an existing chart to a Heiken-Ashi, right-click anywhere the Chart window, select Edit Chart and choose Heiken-Ashi in the Edit Chart window as described above.