eSignal 12 Series - Show Cursor Labels
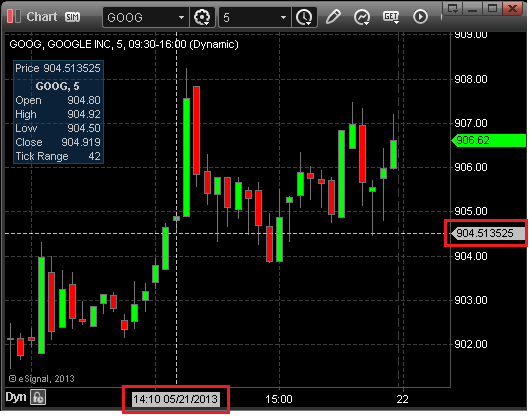
Did you know that you can display labels to track the date, time, and price for wherever your cursor is pointed to on your chart?
Instructions


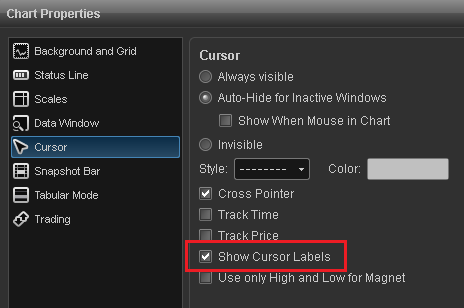
To display cursor labels, right click the chart and select Properties. Choose Cursor on the left hand side of the menu then add a checkmark next to Show Cursor Labels.

On the Y-Axis the price will correspond to the cursor location. On the X-Axis you'll see either Date and Time (for Intraday Intervals) or just the Date for Daily intervals and larger.
