Hot Lists are powerful pre-built scans that look through the markets to identify the best trading opportunities and update them automatically every 30 seconds. The traditional gainers, losers and volume lists are joined by other, unique scans, such as Unusual Volume, Most Volatile and Trade Rate Hot Lists, the last of which displays the fastest trading stocks in the last minute and allows a momentum trader to see what is moving right now and react accordingly.
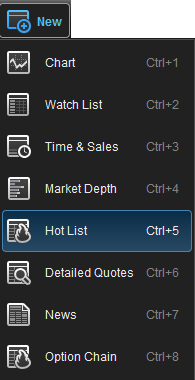
To open a Hot List, select New from the main menu then click Hot List.
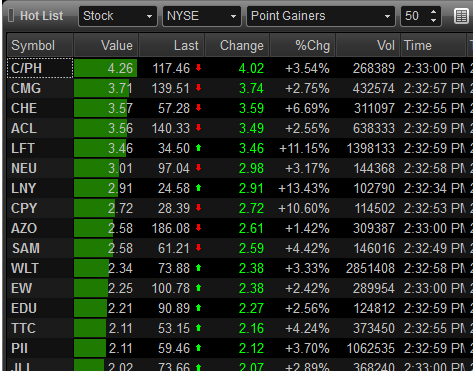
The Hot List appears in a spreadsheet format with the symbols listed by Value (not real-time, updated every 60 seconds). The Value is dependent on the Hot List selected. A description of the various Hot Lists can be found below.
To avoid the inclusion of thinly traded equities, only equities that trade at least 100,000 shares with at least 50 transactions will be included in the results, although some exceptions may apply. Hot Lists begin to calculate at pre-market open (8:30 am ET) with some lists continuing to update with post market activity (NASD Trade Rate, for example).
Hot Lists Exclusions: Nano-cap Stocks
Over the last few years, Hot Lists have been quite popular as these quick market scans help to generate lists of stocks for clients to watch during a trading day. We have received a lot of positive feedback on this feature, and in 2011 we expanded it to include the Canadian and ETF markets. One piece of feedback we continue to receive is that small companies are getting in the way of the important movers and shakers.
U.S. Stocks under a $50M Market Cap. (typically referred to as "Nano-cap Stocks") are excluded from the Hot Lists.
Canadian Markets - TSX and CAN symbols under a $25M Market Cap. and TSX Venture stocks with less than a $10M Market Cap are excluded.
Hot List Configuration
On the Title Bar at the top of each Hot List, you'll be able to customize each scan using the following options. 
Choose from Stock or Index.

Select a specific exchange for your scan. Alternatively, you can then select a more general market (i.e. US or Canadian issues):

Next, choose a Hot List. A description of each list can be found below.
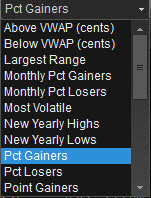
Hot List Descriptions
Above VWAP (cents): Stocks whose current price is farthest above the Volume Weighted Average Price (VWAP) for the day
Below VWAP (cents): Stocks whose current price is farthest below the Volume Weighted Average Price (VWAP) for the day
Largest Range: Stocks with largest net difference between today's high and low (or yesterday's close, if outside today's range)
Monthly Pct Gainers: Stocks with the largest percentage gain in price in the last month
Monthly Pct Losers: Stocks with the largest percentage drop in price in the last month
Most Volatile: Stocks with the largest percentage difference between today's high and low. Click here for more info
New Yearly Highs: Stocks with the largest percentage gain versus their 52-week high
New Yearly Lows: Stocks with the largest percentage drop versus their 52-week high
Point Gainers: Symbols with the largest positive Net change from yesterday's close
Point Losers: Symbols with the largest negative Net change from yesterday's close
Pct Gainers: Stocks with the largest positive Net percentage change from yesterday's close
Pct Losers: Stocks with the largest negative Net percentage change from yesterday's close
Quarterly Pct Gainers: Stocks with the largest percentage gain in price in the last three months
Quarterly Pct Losers: Stocks with the largest percentage drop in price in the last three months
Trade Rate: Trade Rate: Stocks with the most number of trades in the last 30 seconds (part of calculation based on 65-day avg daily volume)
Trades: Stocks with the most number of transactions recorded today
Unfilled Gaps: Stocks with the largest unfilled opening gap - where the stock opens away from yesterday's close
Unusual Volume: Stocks whose volume today is farthest above the 65-day average daily volume (volume has to be greater than 50000)
Very Short Term Down: Stocks whose current price is farthest below the extreme high price of the last fifteen minutes
Very Short Term Up: Stocks whose current price is farthest above the extreme low price of the last fifteen minutes
Volume: with the highest number of shares traded today
Volume Rate: Stocks with the most number of shares traded in the last minute (based on 65-day avg daily volume)
Weekly Pct Gainers: Stocks with the largest percentage gain in price in the last five trading days
Weekly Pct Losers: Stocks with the largest percentage drop in price in the last five trading days
You may then request any number of results from 1 to 100 for each list:

You can choose to display the results in two columns instead of one by clicking the Summary Mode button:
Editing Columns
You can change the order of the Column headings by clicking and dragging. Left click any column and drag right or left to move to a new position. 
Right-click an existing Column to add or remove it. 
Add Column: Displays a submenu which allows you to select to columns to add: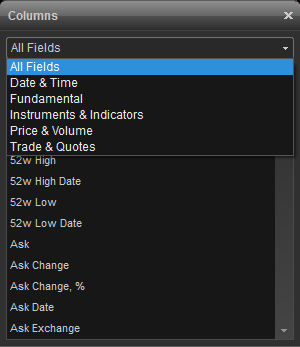
Remove: Removes the selected column from the header bar.
Arrange Columns: Sizes columns so that they are “best fit” width.
Hot List Menu
On the main menu you'll find a Hot List Icon when the Hot List is the active window (the last window that has been selected).
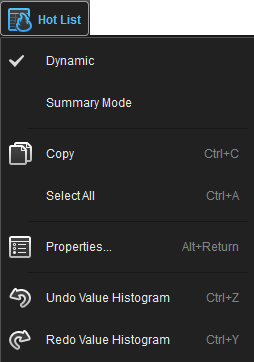
Dynamic vs Static Display: If Dynamic is checked, all the symbols will be Streaming in Real-Time with each symbol counted towards your symbol limit. If Dynamic is unchecked the symbols will be in Static mode where the symbols will not update or count against your symbol limit.
Copy: Allows you to copy a symbol or symbols to another window, such as a Watch List window.
Select All: Allows you to select all the symbols in the Hot List window to another window.
Properties: See Hot List Properties below.
Undo Value Histogram: Toggles the Value Histogram off display in the window.
Redo Value: Toggles the Value Histogram display on in the window.
Hot List Properties
The Hot List Properties allows you to customize colors, font settings, and more.
Default Cell
Symbol Field
Grid Lines
Direction
Histograms
The Default Cell menu allows you to specify the Font Type and Size along with a button for Bold and Italics. There are color settings which include Text and Background. Background #2 is checked if you prefer alternating colors for each row.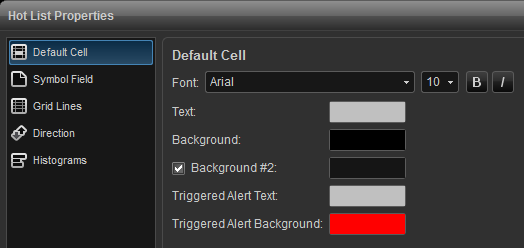
Symbol Field
Change fonts, colors, and toggle between displaying the symbol or description of the listed issues. Background #2 is checked if you prefer alternating colors for each row. You can opt to Show Symbol as Description which will display the description vs. the symbol. 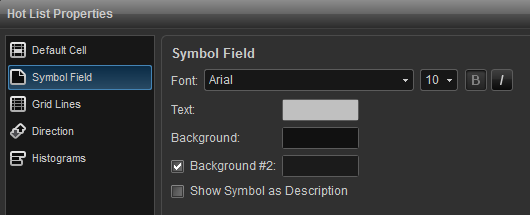
Grid Lines
Add vertical and horizontal gridlines and to change the color of the lines.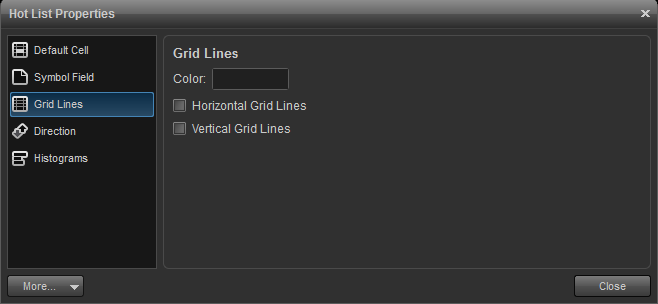
Direction
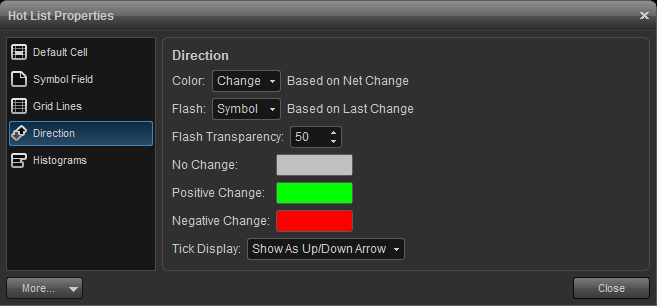
Change the color and display of when a tick is up or down using this menu. The Color field allows you to choose a column (Symbol, Last, Change, All Cells) for the color display which is based on Net Change. Green (Up) indicates a positive change, Red (Down) indicates a negative change, and Grey (Zero) indicates no change. Tick display allows you to toggle between using arrows or +/- for changes up and down.
Histograms
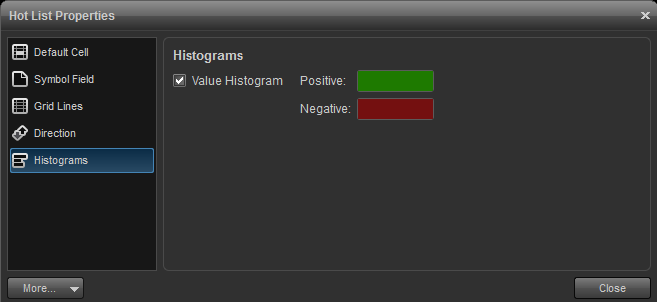
The values in the Hot List can be displayed as a histogram. Toggle this setting on or off by checking/unchecking Value Histogram. You can edit the colors used for Positive vs. Negative results.
 `
`