eSignal 12 - Back Test Report
back testing gives you the ability to test built-in and customized trading strategies and efs studies against historical data to see how they perform. the back test report window provides a wealth of statistics to evaluate the performance of a strategy. the report consists of four pages: strategy analysis, trade analysis, trades, periodical analysis, graphs, and settings.
to access the back test report window, you must first add a back testing efs study to the chart. you can use one esignal's pre-built back testing examples by right-clicking on the chart and selecting insert study. select the formulas tab and expand the back testing examples folder. left-click on the desired formula to apply to the chart: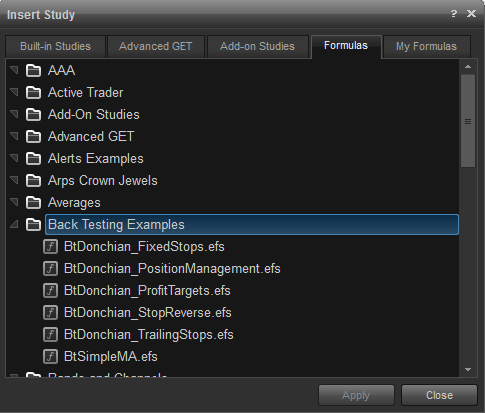
you can also develop and apply your own efs strategy formulas. click here for a guide on how to do it. after applying the back testing study to the chart, select chart on the menu bar, then left-click on show back test report.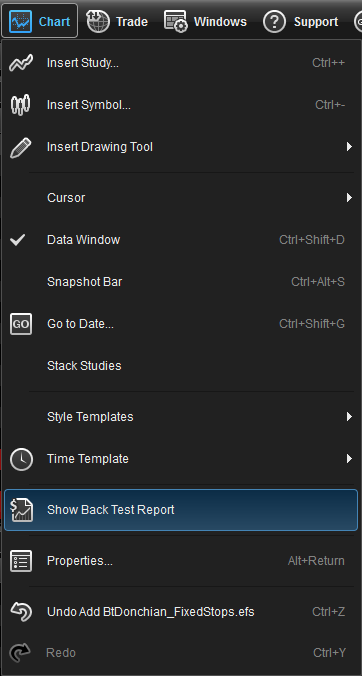
the back test report has six tabbed sections: strategy analysis, trade analysis, periodical analysis, graphs, and settings. many of the settings are customizable and can be changed in the properties dialog box, in the costs/capitalization section.
strategy analysis
this page of the report consists of three sections, the strategy performance summary, performance ratios, and time analysis.
strategy performance summary
the strategy performance summary provides a convenient display of the most significant statistics. as with all the other pages of the report, you can mouse over any of the terms listed and a tool tip will appear, displaying the definition of it, (as illustrated below - adjusted profit factor).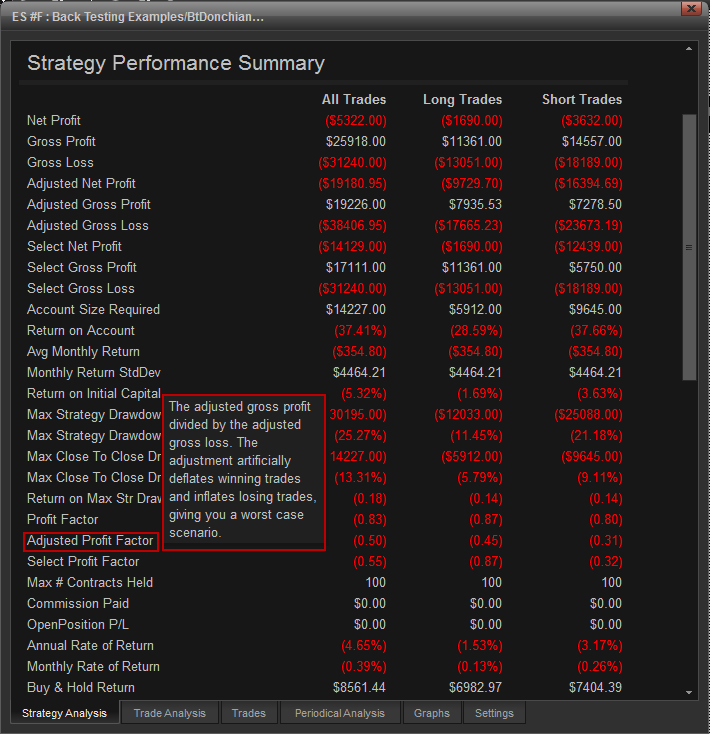
net profit: the overall dollar profit or loss achieved by the trading strategy in the test period.
gross profit: the total sum of every profitable trade generated by a strategy.
gross loss: the total sum of every losing trade generated by a strategy.
adjusted net profit: the difference between the adjusted gross loss and the adjusted gross profit.
adjusted gross profit: is calculated by the total number of winning trades minus its square root, multiplied by the strategies average winning trade profit in $.
adjusted gross loss: is calculated by adding to the total number of losing' trades its square root, multiplied by the strategies average losing trade loss in $.
select net profit: the modified the net profit (with all outlying trades, both positive and negative, removed). the final value thus indicates the net profit for standard trades.
select gross profit: this field adjusts the gross profit by subtracting the results of positive outlier trades from total profitable trades (gross profit).
select gross loss: this field adjusts the gross loss value by subtracting negative outlier trades from total losing trades (gross loss). a trade can be considered an outlier when its profit/loss ratio is more than three standard deviations away from the average profit/loss ratio.
account size required: the amount of money you must have in your account to trade the strategy.
return on account: the sum of money you would make compared to the sum of money required to trade the strategy, after considering the margin and margin calls. this value is calculated by dividing the net profit by the account size required.
avg monthly return: displays the average amount of money return of the total net profit to the initial starting capital for a month, (including commissions and slippage if specified), during the specified period.
monthly return stddev: displays the standard deviation of the average percentage return of the total net profit to the initial starting capital for a month during the specified period. the standard deviation of a probability distribution is defined as the square root of the variance of a data set.
return on initial capital: displays the percentage return of the total net profit to the initial starting capital, (including commissions and slippage if specified), during the specified period. return on initial capital = total net profit divided by initial capital.
max strategy drawdown: displays the greatest loss drawdown, from the previous highest equity run-up, bar to bar looking across all trades, during the specified period. if a new bar equity run-up high occurs, the low equity value is reset to 0 so that the next maximum drawdown can be calculated from that point.
max strategy drawdown (%): displays the greatest loss drawdown, from the previous highest equity run-up, bar to bar looking across all trades, during the specified period. if a new bar equity run-up high occurs, the low equity value is reset to 0 so that the next maximum drawdown can be calculated from that point.
max close to close drawdown: displays the greatest loss drawdown, from the previous highest equity run-up, closed trade to closed trade looking across all trades, during the specified period. if a new closed trade equity run-up high occurs we reset the low equity value to 0, looking for the next maximum drawdown from that point.
max close to close drawdown (%): displays the greatest loss drawdown, from the previous highest equity run-up, closed trade to closed trade looking across all trades, during the specified period. if a new closed trade equity run-up high occurs we reset the low equity value to 0, looking for the next maximum drawdown from that point.
return on max str drawdown: the strategies net profit divided by its maximum strategy drawdown. this is the same as return on account if you do not take margin into account.
profit factor: the dollars amount a trading strategy made for every dollar it lost. this value is calculated by dividing gross profits by gross losses.
adjusted profit factor: the adjusted gross profit divided by the adjusted gross loss. the adjustment artificially deflates winning trades and inflates losing trades, giving you a worst case scenario.
select profit factor: displays the amount made in relation to the amount lost, excluding trades more than set number of standard deviations from the average trade. this value is calculated by dividing select gross profit by select gross loss. by definition, a value greater than 1 means the strategy has a positive select total net profit.
max # of contracts held: the maximum number of contracts held at any one time.
commission paid: the total sum (in $) paid in brokerage commissions. slippage is not included.
open position p/l: the profit/loss for the position currently open. if you do not have an open position, the field returns n/a.
annual rate of return: the annual rate of return of the strategy for the test period. monthly rate of return - the monthly rate of return of the strategy for the test period.
buy & hold return: the return you would have gained if you had bought and held for the whole duration of the test period.
performance ratios
displays risk-adjusted profit/loss performance measurements.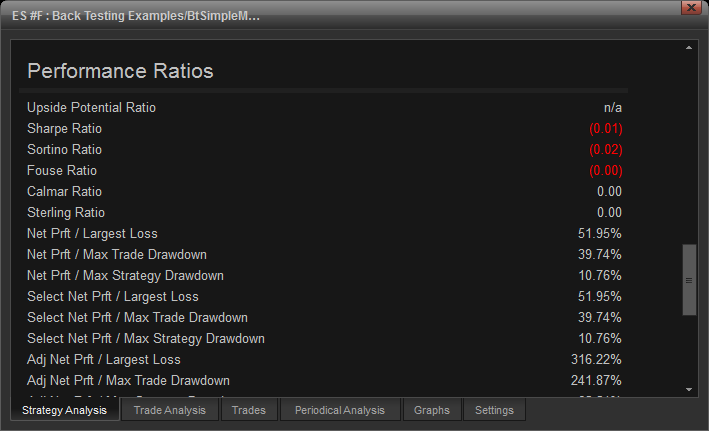
upside potential ratio: is the probability weighted average of returns above the reference rate.
sharpe ratio: measures the return per unit of risk. also referred to as the reward-to-variability ratio. the formula is sr = mri - rfr / sd, where mri is the average monthly return, rfr is the risk-free rate return, which is customizable. sd is the standard deviation of returns.
sortino ratio: similar to the sharpe ratio but uses downside deviation with respect to a reference point. the reference point, which may also be called the minimal acceptable rate of return, is used to distinguish "risk" from "volatility". the formula is mr - mar / dd. mr is the monthly average return, mar is the minimal acceptable rate of return, and dd is the downside risk.
fouse ratio: a measure of risk-adjusted performance that accommodates different degrees of risk aversion. it indicates the net return earned after subtracting the risk premium that corresponds to the investors risk tolerance and choice of risk measure.
calmar ratio: measures return relative to drawdown (downside) risk. is calculated by using the compound annualized rate of return over the last 3 years divided by the maximum drawdown over the last 3 years. if three years of data is not available, the available data is used.
sterling ratio: this is a return/risk ratio. is calculated by using the compound annualized rate of return over the last 3 years divided by the maximum drawdown over the last 3 years less 10%. if three years of data is not available, the available data is used.
net prft / max trade drawdown: the total net profit divided by maximum trade drawdown.
net prft / max strategy drawdown: the total net profit divided by maximum strategy drawdown.
select net prft / largest loss: the select net profit divided by the largest losing trade.
select net prft / max trade drawdown: the select net profit divided by maximum trade drawdown.
select net prft / max strategy drawdown: the select net profit divided by maximum strategy drawdown.
adj net prft / largest loss: the adjusted net profit divided by the largest losing trade.
adj net prft / max trade drawdown: the adjusted net profit divided by the maximum trade drawdown.
adj net prft / max strategy drawdown: the adjusted net profit divided by the maximum strategy drawdown.
time analysis
displays statistics based on time.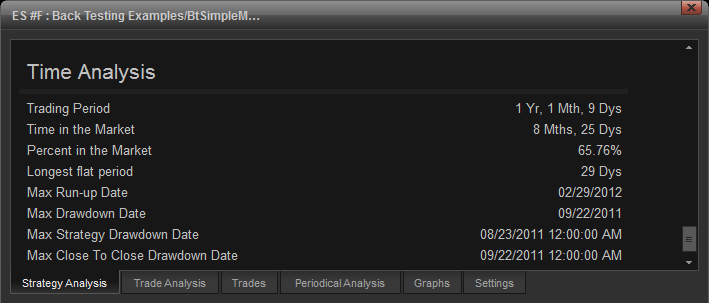
trading period: the length of the test period.
time in the market: the time that the strategy is in market.
percent in the market: the trading period divided by the time in the market.
longest flat period: the longest period the strategy refrained from trading, the systems patience measure.
max run-up date: the date and time of the maximum run-up.
max drawdown date: the date and time of the maximum drawdown.
max strategy drawdown date: the date and time of the maximum strategy drawdown.
max close to close drawdown date: the date and time of the maximum close to close drawdown.
trade analysis
the trade analysis tab focuses on separate trades to estimate the overall strategy performance, with general trade analysis included. 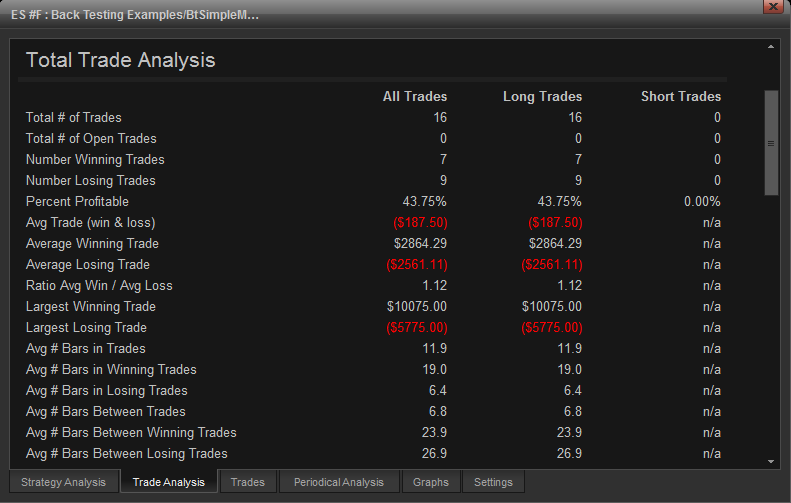
total # of trades: the total number of trades (both winning and losing) generated by a strategy.
total # of open trades: the number of positions currently open.
number of winning trades: the total number of winning trades generated by a strategy.
number of losing trades : the total number of losing trades generated by a strategy.
percent profitable: the percentage of winning trades generated by a strategy. calculated by dividing the number of winning trades by the number of total trades generated by a strategy.
avg trade (win & loss): the amount gained or lost by the average trade generated by a strategy.
average winning trade: the gross profits divided by the number of winning trades generated by a strategy.
average losing trade: the gross losses divided by the number of losing trades generated by a strategy.
ratio avg win / avg loss: the average value of winning trade divided by the average losing trade generated by a strategy.
largest winning trade: the largest winning trade generated by a strategy.
largest losing trade: the largest losing trade generated by a strategy.
avg # bars in trades: the average number of bars that elapsed during trades for all closed trades.
avg # bars in winning trades: the average number of bars that elapsed during trades for all winning trades.
avg # bars in losing trades: the average number of bars that elapsed during trades for all losing trades.
avg # bars between trades: the average number of bars that elapsed between trades.
avg # bars between winning trades: the average number of bars that elapsed between winning trades.
avg # bars between losing trades: the average number of bars that elapsed between losing trades.
outliers
displays statistics for trades which do not occur within the expected range of 1 or more standard deviations of all trades. you can change the standard deviation value in the properties dialog box, in the costs/capitalization section.
1 std. deviation of avg. trade: displays 1 or more standard deviation of avg. trade.
avg. trade + 1 std. deviation: displays avg. trade + 1 or more standard deviation.
avg. trade - 1 std. deviation: displays avg. trade - 1 or more standard deviation.
number of outliers: number of trades generated by a strategy which did not occur within the expected range of 1 or more standard deviation of all trades.
outlier profit/loss: displays the profit or loss for all outliers during the specified period.
run-up/drawdown
shows the largest equity increase (run-up) and largest decrease (drawdown) that took place during the test period. 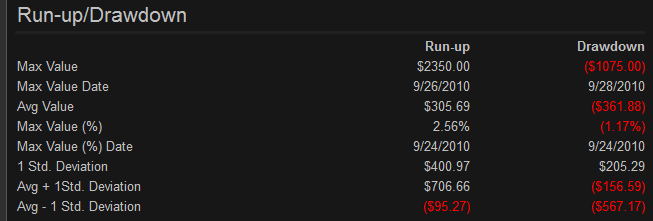
max value: displays the maximum profit or loss that occurred across all the trades.
max value date: displays the date on which maximum profit or loss across all the trades.
avg value: displays the average profit or loss that occurred all the the trades.
max value (%): displays the maximum percent profit or loss that occurred across all the trades.
max value (%) date: displays the date on which maximum percent profit or loss occurred across all the trades.
1 std. deviation: displays 1 or more standard deviation. you can change the standard deviation setting in the properties dialog box, in the costs/capitalization section.
avg + 1 std. deviation: displays avg + 1 or more standard deviation. you can change the standard deviation setting in the properties dialog box, in the costs/capitalization section.
avg - 1 std. deviation: displays avg - 1 standard deviation. you can change the standard deviation setting in the properties dialog box, in the costs/capitalization section.
trade series analysis
displays how "streaky" the strategy is.

z-score: displays how many standard deviations from the mean or the expectation of a random distribution of streaks of wins and losses.
confidence limits: also known the degree of certainty.
strategy me: displays mathematical expectation which is the expected average amount of profit or loss of each trade.
max consec. winners: the longest sequence of consecutive of winning trades generated during the strategy run.
max consec. losers: the longest sequence of consecutive of losing trades generated during the strategy run.
largest consec. profit: the largest profit of the winning series of trades generated during the strategy run.
largest consec. loss: the largest loss of the losing series trades generated during the strategy run.
largest consec. profit (%): the relation of the largest consecutive profit to the strategy's equity size at the moment of profit.
largest consec. loss (%): the relation of the largest consecutive loss to the strategy's equity size at the moment of loss.
trades
trades tab represents each trade as a multi-column sheet. 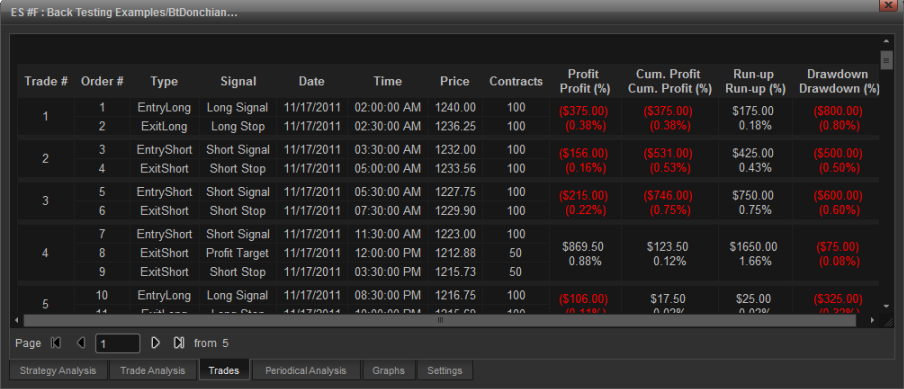
trade #: the trade number of each trade, in the order of trade occurrence.
order #: the trade number of each order, in the order of order occurrence.
type: the description of the signal used to enter the position.
signal: the description of the signal used to enter the position.
date: the entry and exit dates of each trading position.
time: the entry and exit time of each trading position.
price: the execution price of each transaction.
contracts: the number of contracts (or shares for stocks) trades in each transaction.
profit & profit (%): the profit or loss for each position.
cum. profit & cum. profit (%): the running total of the profits and losses all trades.
run-up & run-up (%): measures the open to the highest unrealized high of the trade for a long position, and from the lowest unrealized low of the trade for a short position.
drawdown & drawdown (%): measures the open to the lowest unrealized low of the trade for a long position, and from the highest unrealized high of the trade for a short position.
periodical analysis
strategy performance is evaluated as related to periods of time (daily, monthly or annual) to evaluate the consistency of a strategy. 
graphs
the graphs tab adds a visual display for equity and trades statistics. 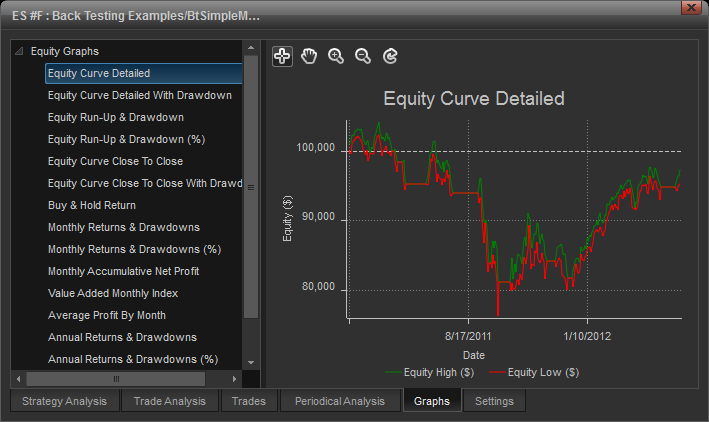
settings
the settings tab displays the setting values that the back test report uses to analyze the strategy. many of the settings are customizable and can be changed in the properties dialog box, in the costs/capitalization section.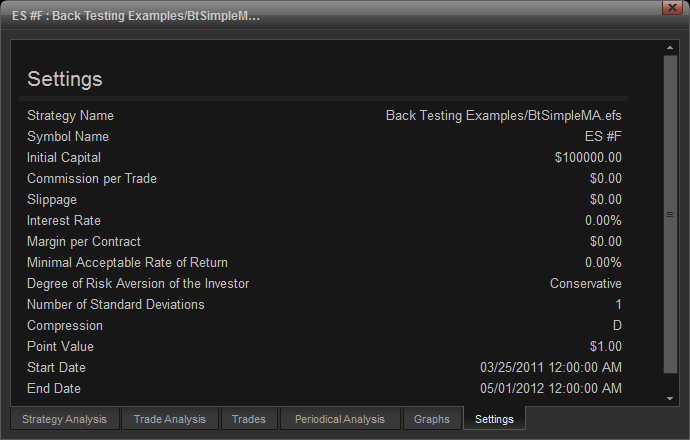
many of the following fields can be customized in the costs/capitalization section below.
strategy name: the name of the strategy applied.
symbol name: name of the symbol to which the strategy has been applied.
initial capital: the amount of capital initially been invested for the specified market.
commission per trade: the amount of commission applied to each trade.
slippage: the difference in price between price when the order was placed and the price the order was actually executed at.
interest rate: the rate of interest earned for uninvested funds. is used to calculate the sharpe ratio.
margin per contract: the amount (in $) paid as margin per contract.
minimal acceptable rate of return: the minimal acceptable rate of return. is used for calculating the upside potential ratio, sharpe ratio, sortino ratio, calmar ratio, and steling ratio in the performance ratios section of the strategy analysis tab.
degree of risk aversion of the investor: the degree of risk aversion. used to the fouse index.
number of standard deviations: is the number of standard deviations used in the trade analysis tab section.
compression: the time frame used to plot the data bars on chart to which the strategy is applied.
point value: price measure of a single point.
start date: the first date in the chart to which the strategy is applied.
end date: the last date in the chart to which the strategy is applied.
properties
to display the properties dialog box for the back test report, right-click in anywhere within the back test window and select properties. 
you can also use the default alt+return keyboard shortcut to display it.
costs/capitalization
allows you to set the value for the customizable settings in the report.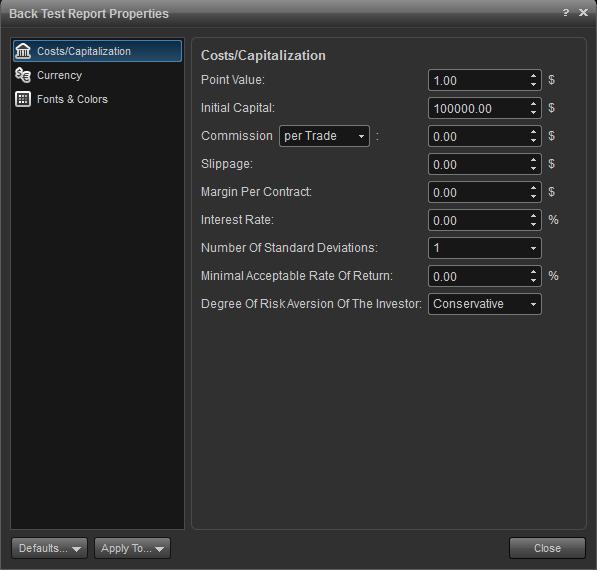
point value: price measure of a single point.
initial value: the amount of capital initially been invested for the specified market.
commission [per trade or per contract]: the amount of commission applied to each trade.
slippage: the difference in price between price when the order was placed and the price the order was actually executed at.
margin per contract: the amount (in $) paid as margin per contract.
interest rate: the rate of interest earned for uninvested funds which is used for calculating the sharpe ratio in the performance ratios section of the strategy analysis tab.
number of standard deviations: used to set the number of standard deviations for many of the fields in the trade analysis tab.
minimal acceptable rate of return: select set the minimal acceptable rate of return you want to use for calculating the upside potential ratio, sharpe ratio, sortino ratio, calmar ratio, and steling ratio in the performance ratios section of the strategy analysis tab.
degree of risk aversion of the investor: the degree of risk aversion used in calculating the fouse index in the performance ratios section of the strategy analysis tab. select between aggressive, moderate or conservative.
currency
allows you to choose the currency and number of decimal places.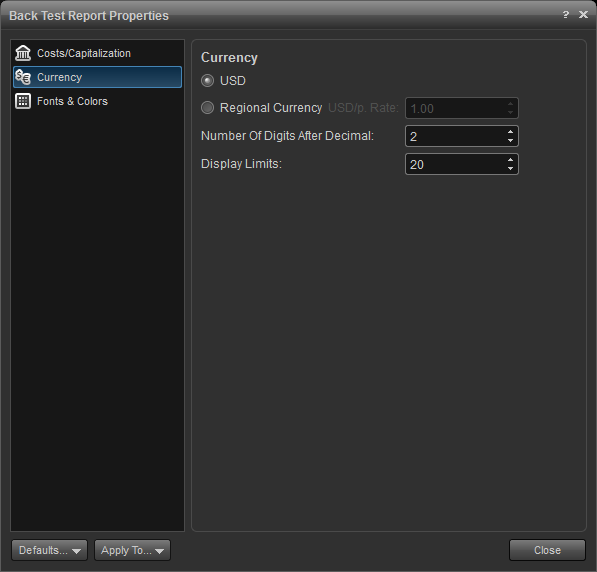
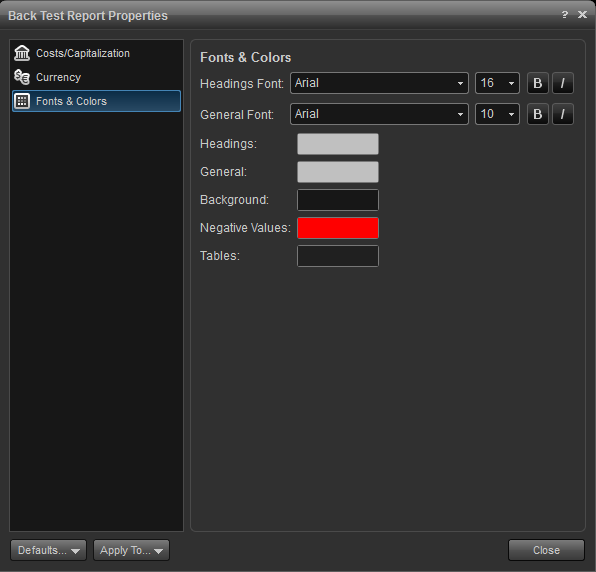
fonts & colors
allows you to choose the fonts and colors of the report.