esignal 12 - advanced get scanner
opening the advanced get scanner
filter & options tab
technical analysis tab
scanner properties
configuring scan results window
scan parameters
overview
the advanced get scanner searches the u.s. stock markets in real time to find possible trading situations based on advanced get strategy setups such as type one,type two, stochastic, xtl breakouts, and trading with the trend. it also allows you to combine a number of standard studies and indicators, including the adx, dmi, macd, stochastics, etc for customized scans.
the advanced get scanner requires a subscription which can be added through account maintenanceaccount maintenance
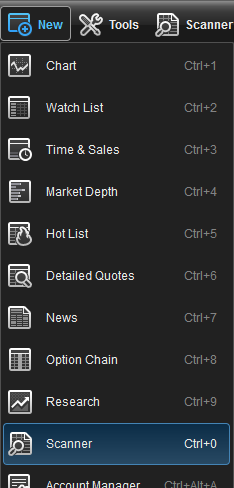
the advanced get scanner can be opened within the esignal program by clicking on new on the main menu and selecting scanner. a keyboard shortcut (ctrl+0) is also available.
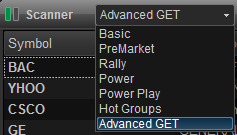
select advanced get in the upper left hand corner of the scanner window.
scanner set up
to set up the advanced get scanner, click on the filter button located at the top of the scanner window.
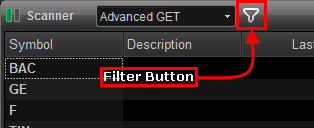
the filter menu will appear with two tabs, the filter & options tab and the technical analysis tab.
filter & options tab

the following is a list of scan criteria:
| Volume | Highest volume traded that day |
| Dollar Volume | Highest dollar volume (volume x share price) that day |
| Heavy Volume | Largest volume compared to their average volume |
| % Gainers | Highest % appreciation that day |
| % Losers | Greatest % depreciation that day |
| $ Gainers | Highest dollar appreciation that day |
| $ Losers | Highest dollar depreciation that day |
| 2 Day High | Stocks that are above there Highest High of the Last 2 Days |
| 2 Day Low | Stocks that are below there Lowest Low of the Last 2 Days |
| 3 Day High | Stocks that are above there Highest High of the Last 3 Days |
| 3 Day Low | Stocks that are below there Lowest Low of the Last 3 Days |
| 5 Day High | Stocks that are above there Highest High of the Last 5 Days |
| 5 Day Low | Stocks that are below there Lowest Low of the Last 5 Days |
| 10 Day High | Stocks that are above there Highest High of the Last 10 Days |
| 10 Day Low | Stocks that are below there Lowest Low of the Last 10 Days |
| 20 Day High | Stocks that are above there Highest High of the Last 20 Days |
| 20 Day Low | Stocks that are below there Lowest Low of the Last 20 Days |
| Year High | Stocks that are above there Highest High of the Last 52 Weeks |
| Year Low | Stocks that are below there Lowest Low of the Last 52 Weeks |
| Bid/Ask Spread | Highest % difference between the bid and ask price |
| Symbol | Sorts the scan results in alphabetical order |
| 3 Day Avg Range | Sorts the scan results based off their 3 Day Avg Range |
| Relative Strength | Sorts the scan results based off the Relative Strength |
Sector
Allows you to view stocks belonging to certain sectors or industry groups only. Sector filters are not applied when scanning Indices.
Exchanges
Select which exchange or IPO criteria:
All (NASDAQ, NYSE, AMEX)
AMEX
ARCX
IPO 2 weeks to 3 months (NASDAQ, NYSE, AMEX)
IPO 3 months - 1 year (NASDAQ, NYSE, AMEX)
NASDAQ
NYSE
Changed
Highlights parameters that have become positive within the selected amount of time. This can be utilized by choosing from Never, In Last 15 Minutes all the way up to 2 days ago.
Time Frame Convergence
Highlights symbols whose parameters are positive in more than one time frame. This too can be utilized by choosing from Never, When All converge, and When Some Converge.
Change From
By default the scan results are calculated base of the previous day's close. This option will allow you to set the results to be based off: Today's Open, Previous Week Close, Previous Month Close, or Previous Quarter Close.
Min 3 DAR/Max 3 DAR
You can choose the minimum and maximum price range of the stock based on the last three days. This is very important to day and options traders. For day traders, stocks with a larger daily range provide the potential for tradable swings during the day. Some options strategies look for stocks to expire within a small range while others require larger ranges. Range Selection accommodates the various options strategies.
Min/Max Price
Allows you to set price brackets (ie., minimum/maximum dollar value per share) to focus on stocks best suited to your trading needs.
Min Volume
The Min Volume is used to select whose daily traded volume exceeds the specified value. For example: If Min Volume is set to 100k, this means a stock has to trade over 100,000 shares to be included in the scan.
Min Average Volume
The Min Avg Volume is used to select stocks whose last 20 day average volume exceeds the specified value (in thousands). For example: If Avg Volume is set to 2000k, this means a stock has to trade over 2,000,000 shares average per day over the last 20 days to be included in the scan. Helpful for weeding out very thinly traded stocks whose movements are not supported by sufficient volume for trading.
Filter By Month
Filters for stocks that were up or down for the month.
Filter By Quarter
Filters for stocks that were up or down for the quarter.
Filter By Day
Filters for stocks that were up or down for the day.
Filter By Week
Filters for stocks that were up or down for the week.
Capitalization
Allows you to eliminate stocks whose market capitalization are outside the specified boundaries.
Symbols to Display
Allows you to set the number of issues that are displayed at one time.
Technical Analysis Tab

Check this box to have the results are based on all filter criteria being met.
Main Filters
Under the Main Filters section you can select time frames, prebuilt sets, and studies.
Xref filters: Allows you to time frames time frames, prebuilt parameter sets and filters to apply an additional level of filters to scans set up with the Main Filters.
Scan Parameters
There are two types scan parameters, prebuilt sets and studies. Click here for a listing of the definitions for the parameters.
Prebuilt set: The Prebuilt Parameter Set is used to initially scan the market for issues matching its underlying parameters based on Advanced GET trading strategies. If an Prebuilt Xref Parameter Set is also selected, then the results of the initial scan are further examined to see if they also match this second parameter set. The following parameter sets have been predefined:
Possible Type I Buy
Possible Type II Buy
Possible Type I Sell
Possible Type II Sell
Buying with the Trend
Selling with the Trend
Stochastics Buy
Stochastics Sell
XTL Breakout Up (Blue)
XTL Breakout Dwn (Red)
Studies (Filter 1, 2 and 3): In addition to the default strategies, you can also create custom scans using up to 3 study filters. You can combine standard studies and indicators to create custom trading strategies, including, ADX, Elliott Wave, MACD, Stochastics, Moving Averages, Oscillator Pullback, Regression Trend and the Advanced GET set-ups, such as Type 1 and 2.
The following parameters are used either to further refine the trading strategy defined by the Main/Prebuilt Xref Parameter Set, or to create your own customized trading strategy.
ADX/DMI
ADX (Turn Up-4)
ADX (Turn Up-14)
+DMI (Above-4)
+DMI (Below-4)
+DMI (Above-14)
+DMI (Below-14)
Elliott Waves
Elliott Wave 3 Down
Elliott Wave 3 Up
Elliott Wave 4 Down
Elliott Wave 4 Up
Elliott Wave 5 Down
Elliott Wave 5 Up
MACD
MACD (Above)
MACD (Below)
MACD (Cross Above)
MACD (Cross Below)
Moving Average
Moving Average (Price Above 6/4)
Moving Average (Price Below 6/4 )
Moving Average (Price Cross Down 6/4 )
Moving Average (Price Cross Up 6/4)
Moving Average (Price Above 20)
Moving Average (Price Below 20)
Moving Average (Price Above 50)
Moving Average (Price Below 50)
Moving Average (Price Above 100)
Moving Average (Price Below 100)
Moving Average (Price Above 200)
Moving Average (Price Below 200)
Oscillator Pullback
Oscillator Pullback (Positive)
Oscillator Pullback (Negative)
PTI
PTI > 35
Regression Trend Channels
Reg. Trend Channel (Break Up)
Reg. Trend Channel (Break Down)
Stochastic
Stochastic Above 75
Stochastic Below 25
Stochastic NFB Above 75
Stochastic NFB Below 25
XTL (Breakout Bar)
XTL (Down-Red)
XTL (Up-Blue)
Relative Strength
The Advanced GET Scanner is capable of calculating Relative Strength by comparing the stock to the entire market or just the stock’s sector or industry group for strong stocks or weak ones or for those out-performing or under-performing the Dow Jones or NASDAQ indices. You can then rank stocks based on the results of the Relative Strength scan.
Period
This allows you to select the period over which the Relative Strength is calculated, either 3 months, 6 months, 12 months, or a composite of all of these periods.
Compared To
This allows you to select the other issues that an issue is compared against: either just issues within the same group, the same sector, or against all other issues in the market.
Filter Results
This allows you to filter issues based on the selected Relative Strength.
Above: only show those issues whose Relative Strength is greater than the given number.
Below: only show those issues whose Relative Strength is less than the given number.
Outperform: only show those issues whose Relative Strength is greater than that of the selected indices.
Underperform: only show those issues whose Relative Strength is less than that of the selected indices.
Configuring Scan Results Window
Right-click on the column header and select the columns you want displayed.

scanner properties
right click in the scanner window and select properties to access the scanner properties menu which includes the following selections:
default cell
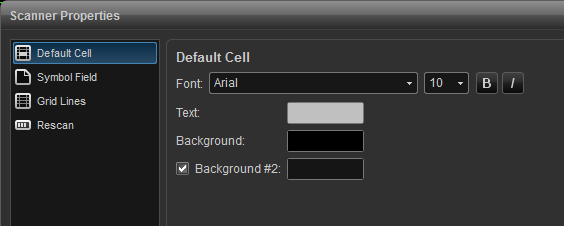
the default cell menu allows you to specify the font type and size along with a button for bold and italics. the color settings include text and background colors. background #2 is checked if you prefer alternating colors for each row.
symbol field
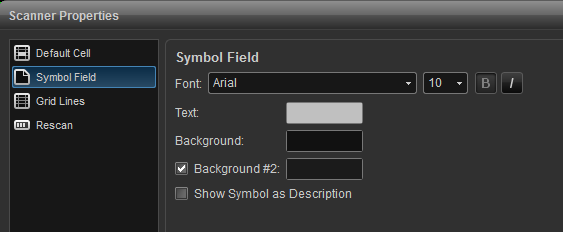
change fonts, colors, and toggle between displaying the symbol or description of the listed issues. background #2 is checked if you prefer alternating colors for each row. you can opt to show symbol as description which will display the description vs. the symbol.
grid lines
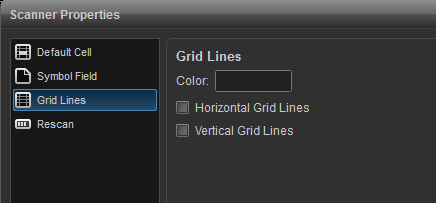
use this menu to add vertical and horizontal grid lines and to customize the color of the grid lines.
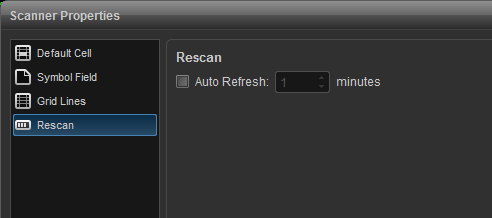
rescan
use this menu to turn on auto refresh which forces the database to be re-scanned in the selected interval.
