eSignal 12 – Fixed Chart Scaling and Lock Scale
fixed chart scaling
the fixed chart scaling feature controls the amount of data displayed on a chart. this feature allows you to display a fixed period of time (e.g. 3-day, 1-month, 1-year,etc).
to enable the fixed chart scaling, click dyn in the bottom left corner of the chart:
you'll see a list of possible time frames (1 day, 1 week, etc) as shown in the image below. you can add or remove time frames by clicking the word customize…. . a time frames menu will open with the list of all existing time frames. this menu allows you to create a custom timeframe. select the numerical value and either days, weeks, months, or years.
applying time frames
for example, let’s say that you are looking at a 5 minute chart of $spx and you will like to see five days of trading. click the dyn icon located at the bottom left corner of the chart window then select “5 days”.
the image below shows two charts, the first chart shows a 5 minute chart for $spx with the default timeframe. the chart below shows the chart with a timeframe for 5 days. the bottom left hand corner of the chart will display “5d” to indicate 5 days.
lock scale
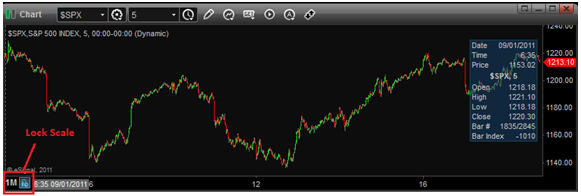
the lock scale feature allows you to lock a specific period of time and analyze that period of time applying different interval periods. once enabled the lock scale icon will turn blue. in the example below we have a 1-month chart for $spx. the x-axis shows a one month timeframe and the month period has the ‘lock scale” enabled with the first bar starting on 9/1/11.
to enable to the lock scale feature, left-click on the lock scale icon  located in the bottom, left-hand corner of the chart:
you can also right-click on the icon and select lock scale on the menu:
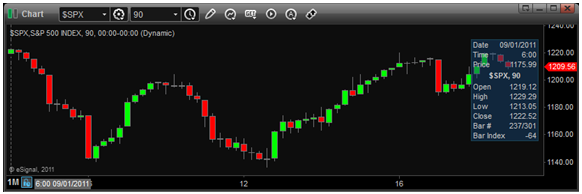
by locking the scale, you can change interval (90 min in the sample below) while retaining the same start date.