esignal 12 - data simulator
the data simulator generates a simulated data stream for any user defined symbol that can be instantly and constantly modified. it allows you to recreate specific market conditions including trends up or down. the data simulator includes the ability to test at any moment your formulas and/or strategies under these conditions without having to wait for them to occur in real time.
insert simulated symbol
to use the data simulator you'll first need to insert a simulated symbol. left-click the gear icon next to the symbol field on the title bar of the chart and select insert simulated symbol. please note you can insert and use the insert simulated symbol in several window types such as the time & sales, market depth, etc. for our example we'll be using the data simulator with the chart window. 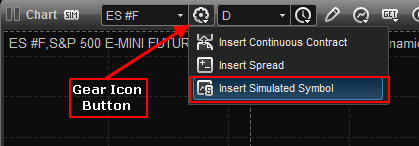
the simulated symbol dialog box will open. 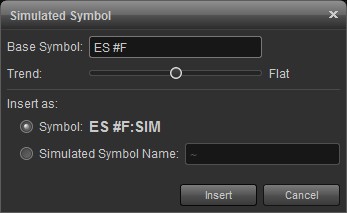
simulated symbol format
to begin, enter the symbol you wish to simulate in the base symbol box. there are two symbol formats to choose from. the first format adds a :sim extension to the end of the symbol. the :sim indicates that you are using a simulated data symbol. 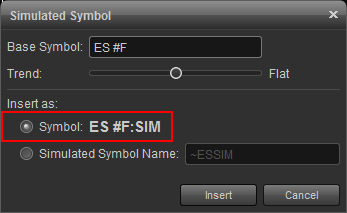
the second option is simulated symbol name, which allows you to create your own symbol. for example instead of using es #f:sim, you can specify a custom symbol which will begin with the tilde symbol (i.e. ~essim in the example below). 
trends
you can also choose from 5 different trend types as specified below. toggle between the trends by sliding the trend slide bar left or right. by default a flat trend is selected.
strong down 
down
flat
up
strong up
data simulator window
to access the data simulator, click tools from the main menu and then select data simulator.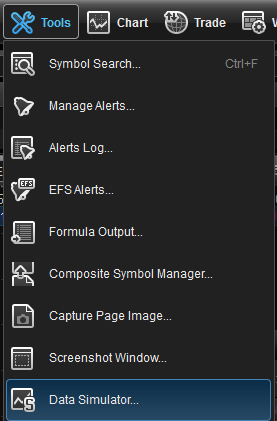
the data simulator allows you to speed up or slow down the trade rate of all simulated symbols. 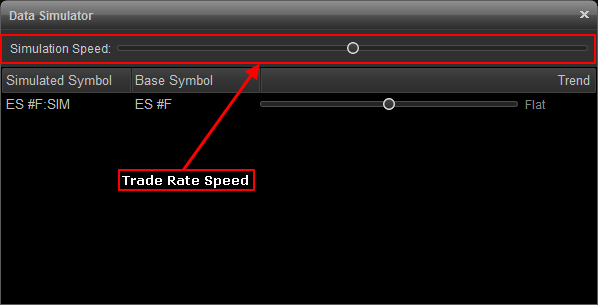
eSignal 12 - Data Simulator
ICE Data Services -