The Market Profile window is used to view the price and volume distribution for a particular trading instrument for a given point in time at various price levels. It was developed and copyrighted by the CBOT (now known as the CME Group). While this methodology was originally designed for analyzing futures, it works on other tradable markets such as stocks and forex as well.
Market Profile is an add-on service. Visit Account Maintenance to add it to your account.
Opening a New Market Profile Window

To display a Market Profile window, click on New, then Market Profile. A keyboard shortcut (Ctrl+Alt+M) is also available.
To enter a new symbol, simply start typing. Finish typing the symbol then click on OK. The Market Profile window is set to a 30 minute interval by default.
Changing Settings
To change any of the default settings, select Market Profile on the main menu bar. You'll see a list of options to choose from.
Components of Market Profile
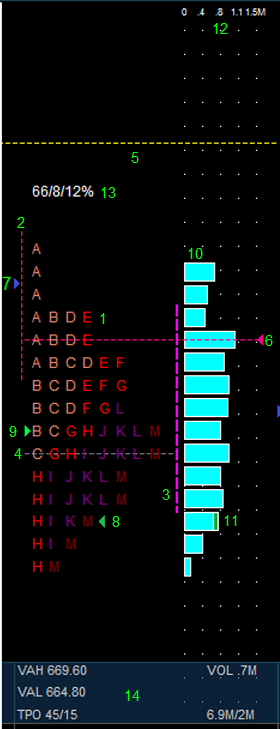
1. TPO: Stands for Time Price Opportunity which is the basic unit of the Market Profile chart. Can be displayed as letters or boxes.
2. Initial Balance: Displays the first two periods of the session. Is indicated by the red vertical line at the beginning of the session.
2. Initial Balance: Displays the first two periods of the session. Is indicated by the red vertical line at the beginning of the session.
3. Value Area: Is one standard deviation or approximately 70% of the trades of the session. Is indicated by the vertical magenta line along the volume bars.
4. POC: Stands for Point of Control. Represents the row where the greatest number of letters exist. If more then one row is tied for the same number of letters, then the row with the highest volume is used.
5. Naked POC: A previous Point of Control that has not been breached.
6. VPOC: Volume Point of Control is the longest volume bar of the session.
7. Open: Indicates the opening TPO.
8. Last: Indicates TPO of the Last price.
9. Middle: Displays the middle point of the session's total number of TPOs. For example, if the session has a total of 50 TPOs, then the triangle designates where the 25th TPO is located.
10. Volume Bars: Display the volume at TPO price levels.
11. Volume Marker for Closing Value: To more easily identify where the distribution closed, there is a green bar at the end of the volume bar. The color of this is tied into the "Last" color in the Market Profile Properties dialog box.
12. Volume Grid: Shows volume levels.
12. Volume Grid: Shows volume levels.
13 .Widest TPO Summary: The first number in is the total number of TPO’s. The second number is the number of TPO’s at the Point of Control, and the third is the percentage that the Point of Control represents of the Total TPO’s.
14. Data Bar: Displays information regarding Value Area High (VAH), Value Area Low (VAL), Time Price Opportunity (TPO) count on the right-hand side of the Data bar and Volume on the right-hand side. The top Volume figure indicates the volume of the bar where the cursor is positioned and the bottom volume figure below indicates the total volume that is above where the cursor is positioned.
14. Data Bar: Displays information regarding Value Area High (VAH), Value Area Low (VAL), Time Price Opportunity (TPO) count on the right-hand side of the Data bar and Volume on the right-hand side. The top Volume figure indicates the volume of the bar where the cursor is positioned and the bottom volume figure below indicates the total volume that is above where the cursor is positioned.
Changing Settings
To change any of the default settings, select Market Profile on the main menu bar. You'll see a list of options to choose from.
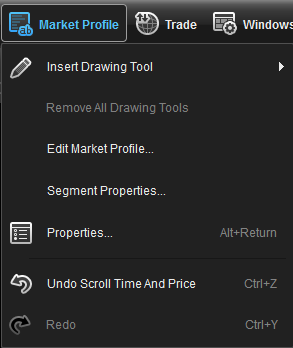
Insert Drawing Tool: Allows you to apply horizontal and vertical lines, text, and up and down arrows.
Remove All Drawing Tools: Removes all applied drawing tools.
Edit Market Profile: Displays the Edit Profile Dialog box to edit parameters and set alerts.
Segment Properties: Displays Segment Properties dialog box to edit TPO properties.
Properties: Displays Properties dialog box.
Undo/Redo: Undo or redo changes that were made.
Right-Click Menu
Settings can also, be changed by right-clicking the on the chart.

Open In: Allows you to open another window with the same symbol.
Add Alert: Allows you place an alert.
Insert Drawing Tool: Allows you to apply horizontal and vertical lines, text, and up and down arrows.
Remove Drawing Tools: Removes all applied drawing tools.
Edit Market Profile: Displays the Edit Profile Dialog box edit to parameters and set alerts.
Add Alert: Allows you place an alert.
Insert Drawing Tool: Allows you to apply horizontal and vertical lines, text, and up and down arrows.
Remove Drawing Tools: Removes all applied drawing tools.
Edit Market Profile: Displays the Edit Profile Dialog box edit to parameters and set alerts.
Segment Properties: Displays Segment Properties dialog box to edit TPO properties.
Add Splits/Remove Splits/Remove All Splits: Allows you to split pre-market TPOs from the regular session data and then to remove the "split" session.
Style Templates: Applies a Style Template.
Time Templates: Applies a Time Template.
Snapshot Bar: Toggles the display of the Snapshot bar on or off.
Merge Left/ Unmerge Distributions: You can merge distributions by selecting Merge Left. You can unmerge a distribution by selecting Unmerge Distribution. You also merge distributions by left-clicking on time scale and dragging it to the left.
Set Tick Increment: Displays the Set Tick Increment dialog box.
Properties: Displays the Market Profile Properties dialog box.
Market Profile Properties

Market Profile
Font: Selects the font.
Background Color: Selects the background color of the Market Profile window.
Initial Balance: Toggles the display of the Initial Balance line on or off and selects it's color.
Value Area: Toggles the display of the Initial Balance marker on or off and selects it's color. Calculate with a user defined percentage value.
POC: Toggles the display of Point of Control marker on or off and selects it's color.
Naked POC: Toggles the display of the Naked Point of Control line on or off and selects it's color.
VPOC: Toggles the display of the Volume Point of Control on or off and selects it's color.
Open: Toggles the display of the Opening TPO marker on or off and selects it's color. Indicates the opening TPO
Last: Toggles the display of the Last TPO marker on or off and selects it's color. Indicates last price.
Middle: Toggles the display of the Middle marker on or off and selects it's color.
Volume: Toggles the display of the Volume bars on or off and selects their color.
Volume Grid: Toggles the display of the Volume Grid on or off and selects it's color.
Widest TPO Summary: Toggles the Widest TPO Summary display on or off and selects it's color.
Status Line
Select Font, Text Color, to Show Description, and Show Session Information.

Scales
Select Font, Colors, to show Left or Right Price Scale, Auto Scale, and set the Margins.

Cursor
Select style and color of the cursor. Toggle the display of the cross point, track time, track price, and show price label.
Select style and color of the cursor. Toggle the display of the cross point, track time, track price, and show price label.

Tick Increment
When you set a Tick Increment, you are changing the breakdown of how many minimum ticks make up each grid on the chart. This determines the height of each price bar. Because it is no longer optimized for the Auto Scale, bars can go above and below the viewable panel, but you can still grab the Price Scale and adjust it or select Auto Scale from a right-click.

Tick Value: Sets the value of each Tick Increment.
Force Tick: When selected, the Tick Value is locked in place and cannot be changed by dragging the Price Scale to change it or use the Auto Scale to change it.
Segment Properties
This menu allows you edit TPO properties.
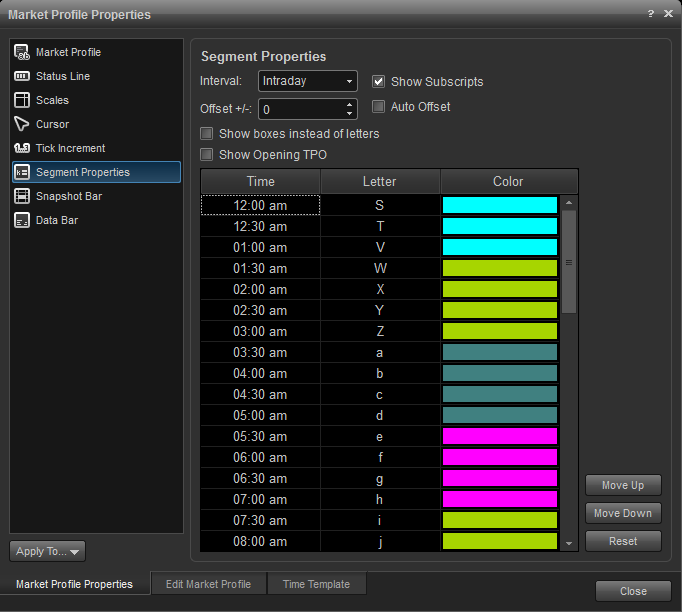
Interval: Sets time interval of TPOs.
Show Subscripts: Subscripts appear as small numbers next to the letters (TPOs) on the Market Profile chart. They are displayed when using an interval that is less than 30 minutes, and represent that portion of the 30-minute segment the price traded at.
Offset: Offsets the opening TPO by the desired number of minutes.
Auto Offset: Will offset the opening TPO by the default time interval.
Show boxes instead of letters: When selected, it changes the display of TPOs from letters to colored boxes.
Show Opening TPO: When selected, it displays the opening TPO with the letter "O" instead of of the selected letter for the opening TPO in Segment Properties.
Time/Letter/Color: You can adjust the letter for each time period and it's color.
Snapshot Bar
Edit Parameters of Snapshot Bar which displays Open, High, Low, Last, and Change.

Data Bar
Configures the display the Data Bar for appearance and to toggle the display of values for VAH, VAL, and TPO.

Editing Market Profile and Setting Alerts
Allows you edit the symbol and interval, as well as set alerts on selected parameters.
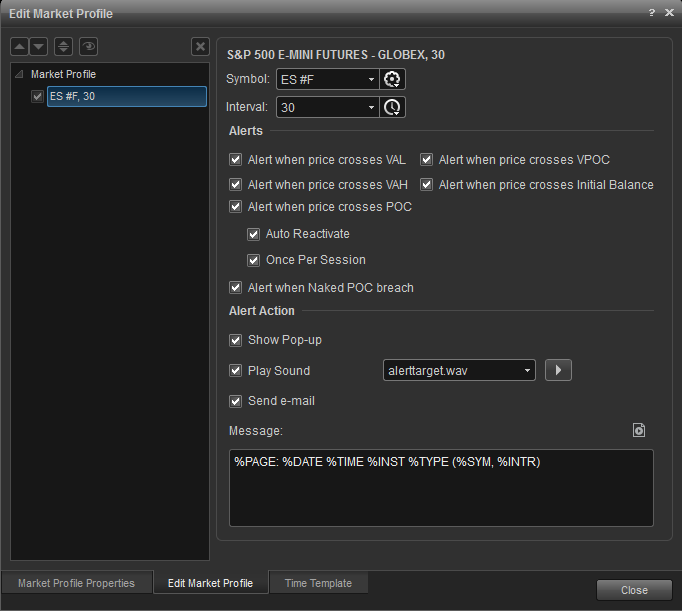
Alerts: Select the parameters that you want to be alerted when triggered.
Auto Reactivate: When checked, the alert will reactivate so it can be triggered again.
Once per Session: When checked, the alert will not trigger again until a new session begins.
Alert Action: Select for when an alert triggers, to get a pop up alert, an audio alert, and if configured, an e-mail alert message.
Once per Session: When checked, the alert will not trigger again until a new session begins.
Alert Action: Select for when an alert triggers, to get a pop up alert, an audio alert, and if configured, an e-mail alert message.