Overview
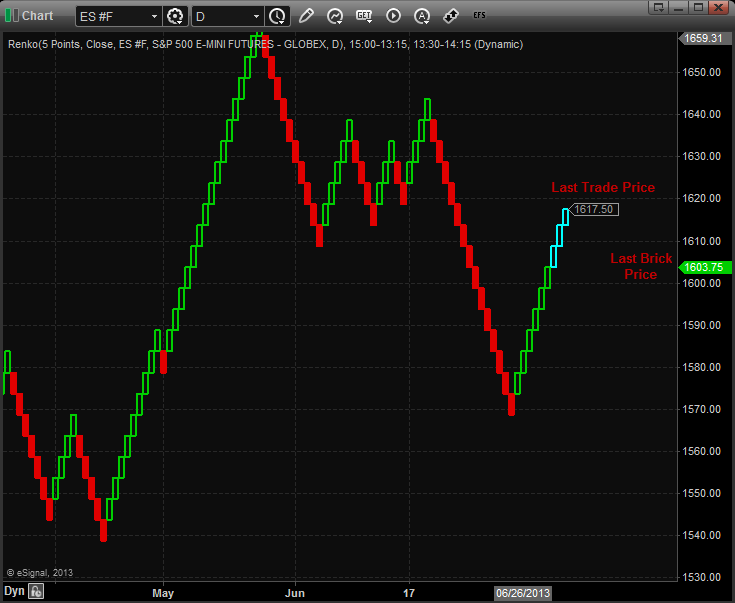
The Renko charting method is thought to have acquired its name from "renga" which is the Japanese word for bricks. Renko charts are similar to Three Line Break charts except that in a Renko chart, a line (or "brick" as they're called) is drawn in the direction of the prior move only if prices move by a minimum amount (i.e., the box size). The bricks are always equal in size. For example, in a 5-unit Renko chart, a 20-point rally is displayed as four, 5-unit tall Renko bricks.
Interpretation
Basic trend reversals are signaled with the emergence of a new white or black brick. a new white brick indicates the beginning of a new up-trend. A new black brick indicates the beginning of a new down-trend. since the renko chart is a trend following technique, there are times when renko charts produce whipsaws, giving signals near the end of short-lived trends. However, the expectation with a trend following technique is that it allows you to ride the major portion of significant trends. Since a renko chart isolates the underlying price trend by filtering out the minor price changes, renko charts can also be very helpful when determining support and resistance levels.
It is critical to note that the behavior of a Renko Chart is determined by the Box Size. When trading instruments have a smaller minimum tick increment, it will be necessary to change the Box Size to a smaller value.
Opening a Renko Chart
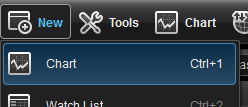
To open a Renko Chart select New from the menu bar and then select Chart.
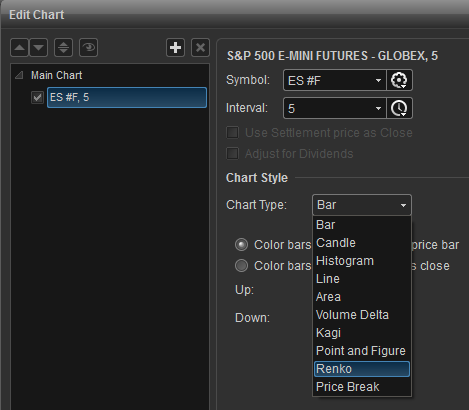
This will open a New Chart window, to change the chart type right click on the Chart window and select Edit Chart. Inside the Edit Chart window select Renko from the Chart Type drop down menu.
Intraday Intervals
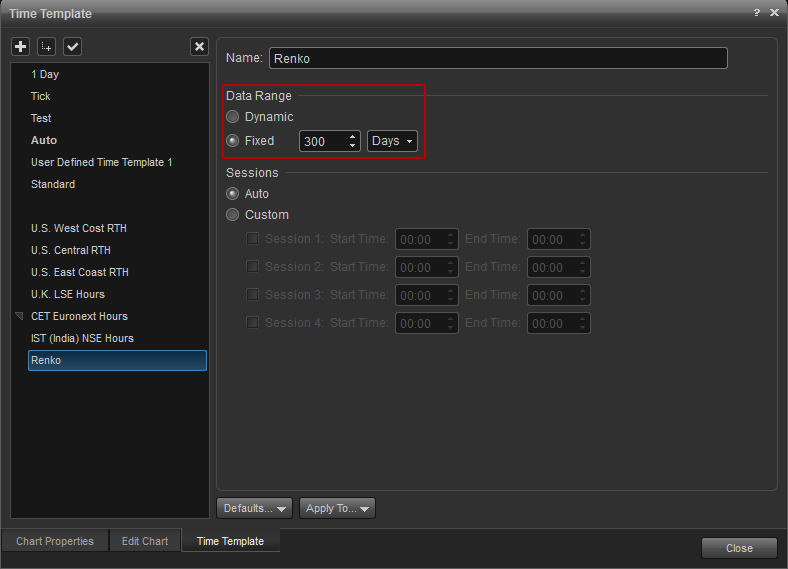
If you using an interval setting of based on intraday time frame, it is recommended that you use a time template with a Data Range setting of a fixed number of days instead of bars. This will prevent the pattern of bricks changing if charts are refreshed/reloaded during the course of a day.
Renko Properties
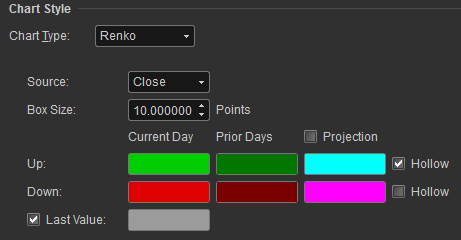
To access the Renko properties window, right click on the chart window and select Edit Chart. Here you can change the Source, Box Size or the Colors for you Renko Chart. You can also enable/disable the Projection option. The Projection option will draw bricks in place as if the interval was closed at the current time.