eSignal 12 - Drawing Tools Overview
eSignal offers a wide array of drawing tools. Recently new tools such as the Ellipse, Rectangle, Triangle and Polylines have been added. The ability to set alerts on the drawing tools and a price ruler to display price distance, percent distance, bar distance and slope is also available. Below is the list of drawing tools and their keyboard shortcuts.

Trend Line
The trend line drawing tool enables you to draw lines to indicate the direction of price movement, mark indicators' trending, define patterns and connect important analytical points in a chart. You can choose to draw the trendline as an arrow, price ruler, or a ray.

Horizontal Line
It draws a horizontal line that goes all the way across the chart. Useful to support and resistance lines in a chart. You can choose to draw a horizontal line with both ends extended, left end extended or right end extended.
Vertical Line
It draws a vertical line from the bottom of the chart to the top. Could be useful to spot cyclical price movements.
Polyline
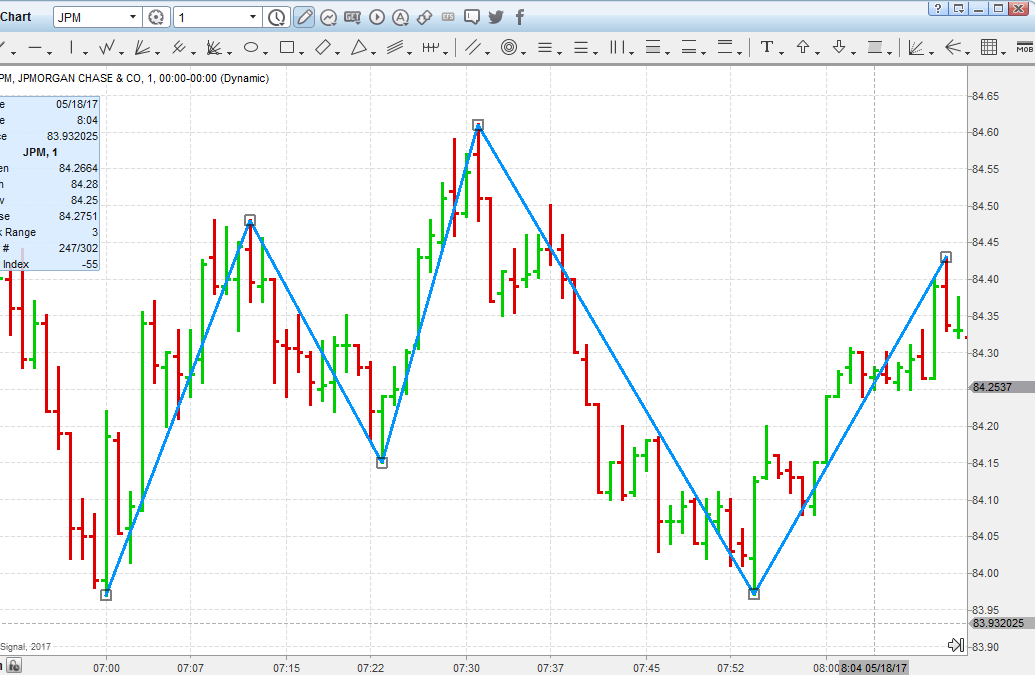
The Polyline is a more flexible tool for drawing multi-sided shapes, drawing swings, or connecting tops and bottoms of trends together to create a living channel of sorts. Basically, a polyline is formed by a series of unlimited clicks. A line segment is drawn between each click and the line is completed with a final double-click action.
In the image below, you'll see an example of this living channel, a visual method for identifying areas of narrow volatility (the uptrend) and increasing volatility (the beginning and top of the trend). Knowing what type of market you are in is vital to understanding how loose or tight your orders need to be, and the polyline tool can assist in drawing these behaviors out.
Speed Resistance Lines (SRL)
Speed Resistance Lines are additional support and resistance tools used to help define expected areas of retracement. Traditionally, the SRL tool uses 1/3 and 2/3 lines as the basis of the support and resistance, and the below chart on GE is a great example of this by catching the resistance points of an attempt to recover the uptrend in April of this year.

More recently, traders have begun to apply Fibonacci (0.382, 0.618) and Gann (0.25, 0.50) ratios with this tool, and even more support and resistance points can come out of this. Using the same example for GE but turn on the default Fib and Gann levels...

There is a breakout at point "A", support of a trend continuation all along the 38.2% line up until another breakout at "B", and a try for another breakout at the 50% line, which became resistance up until today's trading. The 61.8% line could be the next area of support here.
Pitchfork
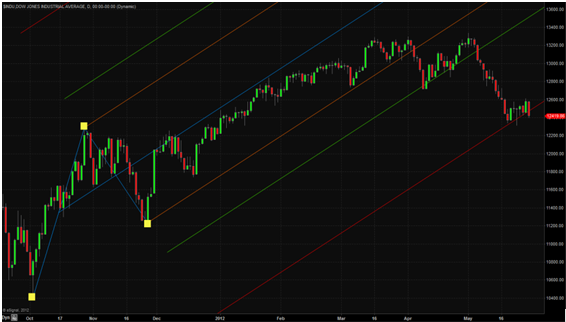
The Pitchfork is a trend channel tool consisting of three lines. There is a median trendline in the center with two parallel equidistant lines on either side. This lines are drawn by selecting three points, usually based on reaction highs or lows moving from let to right on the charts. As with normal trendlines and channels, the outside trendlines mark potential support and resistance areas.
The below image is our modified Pitchfork that has the basis of its median (middle blue) line adjusted to 50% up the first two clicks. The example below shows the $INDU is caught in the channel for 5 months between the median and the first pitchfork "prong" (orange line). After it finally breaks in the beginning of April, it heads down to a 1.618 extension line (green), until it breaks at the beginning of May and the 3.00 extension has now become support. What’s interesting to note is all of these support and resistance lines are built from the trading activity of Q4, 2011.
The Inside Pitchfork is typically used for trading activity that is occurring within a previous trend range as the angle of bottom prong is based on 50% of the first two clicks. For example, the AUD/USD currency pair reached a recent peak in March and was identified by the top prong of this Inside Pitchfork, and if you add some additional inside lines such as 61.8% and 75%, this picks up the internal swings inside that fork.

eSignal offers settings for Schiff Pitchfork and a Modified Schiff Pitchfork under the drawing tool properties.

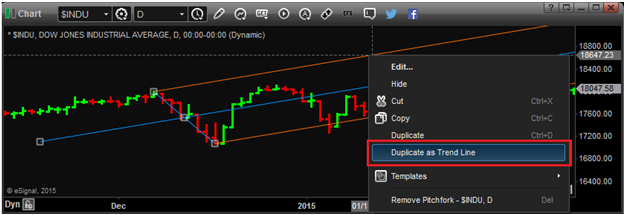
You can duplicate any tine of a Pitchfork as a parallel Trend Line by right-clicking any tine of the Pitchfork and selecting "Duplicate as Trend Line".
Pitchfan

This drawing tool is a unique hybrid of the Pitchfork, Gann Fan and Speed Resistance Line and is a veritable Swiss Army knife of the drawing world. Any pitchfork style could be created as well as the possibility of creating your own style. This is done by adjusting the Slope value of the parallel lines. In addition, fan lines are put into the mix for an additional layer of support and resistance. The trick with this tool is to find what slope settings work best over time for the symbols you trade, and when these lines are respected in the past, they are more likely to be adhered to in the future.

Ellipse
The ellipse tool enables one to draw an oval frame around important parts on a chart that a user would like to highlight.

Rectangle
The rectangle tool draws a box around a specific area within the chart. It is useful for identifying important price movements.

Rotated Rectangle
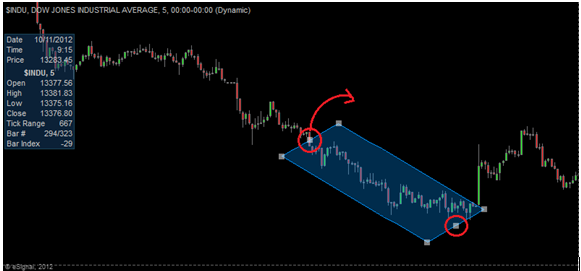
This drawing tool allows you to create a channel with a defined "end-cap" to the trend. It is a great way to encapsulate a trend with the rectangle shape that can be rotated at an angle of your choosing.
Triangles
While simple on the surface, this shape can be a powerful addition to marking support and resistance regions, or establishing patterns of trend retracements or extensions.
Seen below on the left, the blue triangle has been drawn to show an area typically referred to as an ascending triangle or pennant. They typically follow a longer trend up or down and tend to act as platforms for breakouts that continue the earlier trend. The green triangle is marking a rare pattern called the Bullish Gartley. When used in conjunction with the Fibonacci retracements and extensions, the Gartley and Butterfly patterns can be extremely powerful, and the triangle tool can help to draw this out for you in your charts.
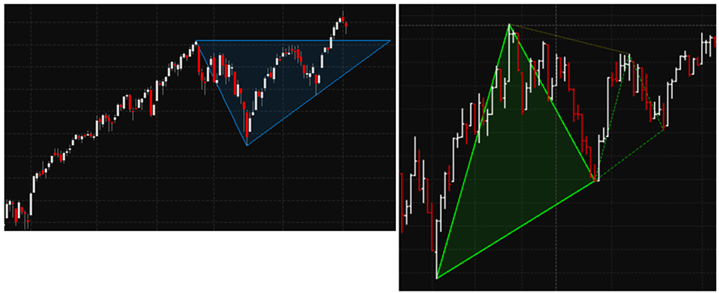
You can draw triangles in your charts by right-clicking the mouse inside the chart, selecting "Insert Drawing Tools" and then clicking Triangle.
Triangles can also be accessed byclicking the triangle icon in the char's drawing toolbar.
Regression Trend Channel
A Regression Trend Channel (RTC) is simply the mathematically standard deviation of the linear regression price data. It is calculated using the actual prices of the bars in the trend. The idea is to draw an upper and lower channel from the linear regression line by using the standard deviation of the prices. The break of a Regression Trend Channel is usually used as an entry or exit signal.

Channel Tool
Drawing parallel lines was always possible in eSignal, we’ve just made it a lot easier now with the new Channel tool. You first start by drawing a basic trend line off the highs or lows of a trend, then a parallel line attaches to your mouse cursor so you can place the top or bottom of the channel. In an example below, the AUD/USD forms a channel between its trading range of March to April, and breaks to the upside. After a failed retracement at 38.2%, the trend continued and settled right back into that same channel.

Fibonacci Circle

Thus far, we’ve looked at price relationships with the Fibonacci Ratios; however, another tool in eSignal takes into account the x-axis. The Fibonacci Circle tool applies time to the concept of trend analysis. How long will it be before the next trend reversal takes place and at what price? Those are the questions that the fib circle is attempting to answer. Numerous ratios are commonly used with this tool; they are 0.382, 0.618, 1.000, 1.382 and 1.618.

Fibonacci Retracement
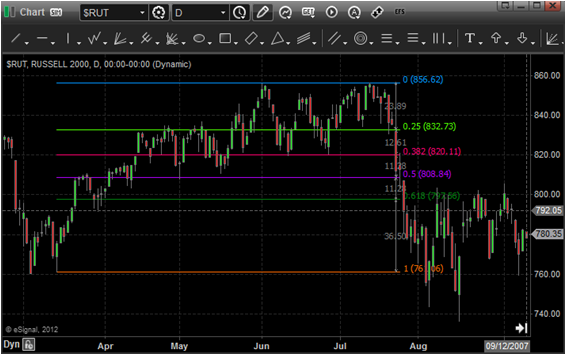
The Fibonacci Retracements tool is used to measure the amount that the market has retraced compared to the overall market movement. When a trend occurs, inevitably, a reversal against that trend results. The Fibonacci Retracement tool attempts to discover the possible price levels where support or resistance may be found. Typically, the 0.382 and the 0.618 ratios are used for this purpose; however, other popular values are 0.25, 0.50 and 0.75.

Fibonacci Extension
The Fibonacci Extensions tool is based on similar principles as those of the Fibonacci Retracement, but instead of measuring how far the pullback on a trend will be, the Extension tool attempts to estimate how far a trend will continue upward after the pullback. The common ratios used with this tool are 0.618, 1.618 and 2.618. is used to measure the amount the market has extended compared to the overall movement. Fibonacci Extensions give you general target price areas. To apply a Fibonacci Extension tool, you will use three (3) clicks.

Fibonacci Time
The Fibonacci Time tool is used a bit differently than the other Fib tools. It may seem simple on the surface, but, actually, it’s attempting to predict the length of future time cycles. A time cycle is the length of time it takes for one trend to complete. This may seem to be what we’ve been measuring all along, but, in fact, a time cycle is actually measured from one major pivot top to the next major pivot top. (Previously, we were measuring from bottom to top or vice versa.) All the common ratios still apply here (1.382, 1.618, 2.618), but we’re just measuring the 0 percent to 100 percent a bit
differently.
