eSignal 12 Series - Fixed Chart Scaling
Did you know that you can load a preset number of Days, Weeks, Months, or Years onto a chart? Fixed Chart Scaling allows you to display a fixed period of time on the chart even after changing the symbol or interval.
Instructions:
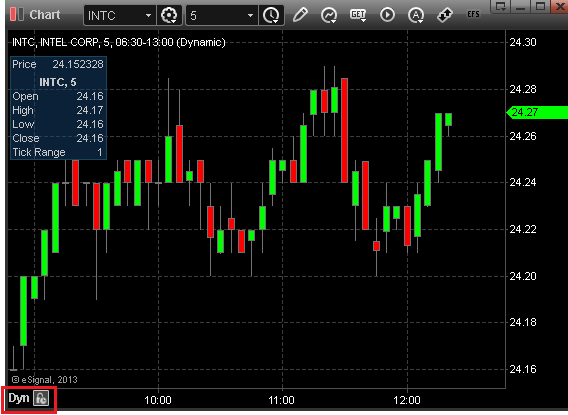
To enable Fixed Chart Scaling, click "Dyn" in the bottom left corner of the chart:

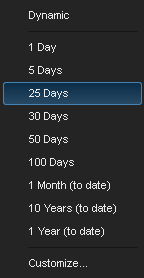
Select the period that you wish to use. You can create your own custom periods by selecting Customize at the bottom of this menu.

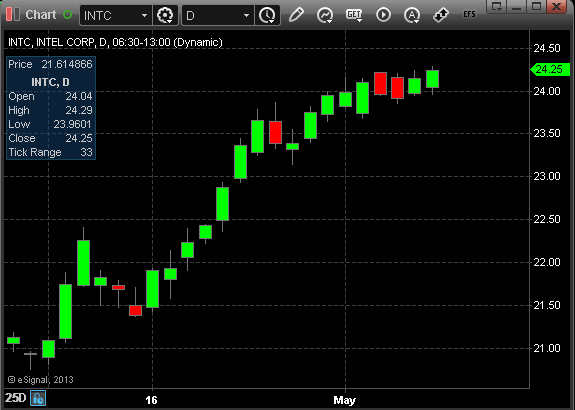
In our example below we've selected 25 Days. On a Daily chart this represents 25 bars of data. The Lock Scale icon turns blue indicating that the scale has been locked even after changing intervals.

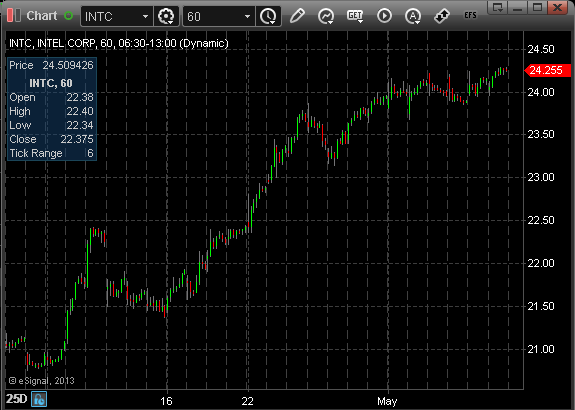
Switching to a 60 minute interval, 25 days of data are still displayed.
