Qcharts - Chart Window
This article provides an overview for using the chart window in QCharts.
Opening a Chart Window
There are three ways a user can open a chart window. The first way is shown below by selecting File from the main menu and clicking New=>Bar Chart.

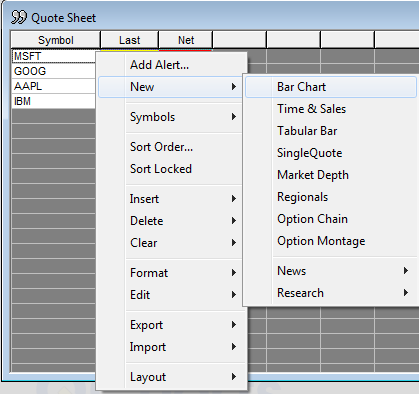
The second way to open a chart window is by right clicking a symbol on a Quote Sheet and selecting New=>Bar Chart.

The last way is by using the shortcut button  at the top of QCharts.
When you add a Chart Window, two new toolbars become active. (Both toolbars appear on the left side of QCharts by default):
The Chart Toolbar

The Drawing Toolbar 
For information on using the Toolbars please click here.
Chart Overview

Data Window
The Data Window is the small information panel within the chart that displays information of the bar your cursor is pointing at such as the Symbol, Date, Price, Open, High, Low, Close. CSR% is the price difference from the reference point set where you clicked the chart. # Bars shows the bar number +/- from the same reference point.
Daily Snapshot Bar
The Daily Snapshot Bar is the window that displays the current Open, High, Low, Close, and Net Change for the symbol displayed in the chart.
Synchronize Buttons
The symbol Synchronize Button
This feature allows you to link the Chart Window to your Quote Sheet and all other windows in your Workspace. Once the symbol link has been activated, a symbol change in one window will be automatically reflected in all of windows that have been linked.
Button Colors A gray symbol button means the chart window is not linked and will only change when it is the active window.
 A green symbol button means the chart window is linked to all the windows in your Workspace.
  A red symbol button means the chart window is locked on the symbol that is on the chart. Meaning that symbol can not be changed.
 A blue symbol button means the Chart Window is linked to call options in an Options Montage Window.
 A yellow symbol button means the Chart Window is linked to put options in an Option Montage Window.
(Note: The option montage window requires a QCharts Plus subscription)
The Interval Synchronize Button
This feature allows you to link the Chart Window to the interval box in the top left hand corner of QCharts. Once the interval link has been activated, the interval you enter will automatically populate to all the charts that are linked with the same color.
Button Colors
 A gray interval button means the chart window is not linked to the interval box and will only change when it is the active window.
 A green interval button means the chart window is linked to the interval box.
 A red interval button means the chart window is locked on the interval that is on the chart. Meaning that interval can not be changed.
Chart window right-click menu
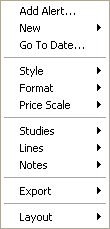
Upon right-clicking the Chart Window, you will see the following menu.

Add Alert
This option allows you to set an alert at the price point you right clicked on.
New
This option allows you to open a new window.
Go To Date
This option allows you to go to a specific date in the Chart Window.
Style
This option allows you to change the chart style of the chart to Bar, Candle, Line or Histogram.
Format
This option allows you to change the font and colors on the chart. It also allows you to turn the Daily Snapshot Bar, Data Window and Cursor Tracking on or off.
How do I use the Cursor Tracking and Data Window function?
The Cursor Tracking and the Data Window features are meant to be used at the same time. These features will allow you to determine the price of a stock, including the Open, High, Low and Close anywhere in the stocks history.
Price Scale
This option allows you to set your scale to Auto Scale or Log scale. you can also turn on the Remember V-scale Preferences feature.
What is the purpose of the Auto Scale feature?
The Auto Scale feature is used to format the price action of a stock that has had enough volatility so that the price action is beyond the upper and lower limits of the chart window. This feature will reformat the price action in such a way that no matter the volatility, the entire chart history will be displayed on the chart.
What does "Remember V-Scale Preferences" do?
The "Remember V-Scale Preferences" feature will recall the y or vertical scale attributes of a specific stock chart that was previously viewed.
Studies
This option allows you to add/edit a study on your Chart Window.
Lines
This option allows you to edit lines or remove lines from the Chart Window.
Notes
This option allows you to add/edit notes on a Chart Window. Notes can be added to a Chart Window to remind you of certain events in a stocks history. This feature can be used to note buy and sell signals or any information that the user deems relevant to that specific security. To save space within the chart window, once the note has been entered, it can be minimized to a smaller format and then moved anywhere within the chart window.
Export
There are two options you can export. The first option is Data, this will allow you to export the data out of the Chart Window and save it as three file types .prn, .csv and .txt. The second option is Image, which will allow you to save a screenshot of the Chart Window.
Layout
This option will allow you to save a chart window in terms of Color, Font, and feature settings so that this layout can be applied to new Chart Windows.
Drawing Lines
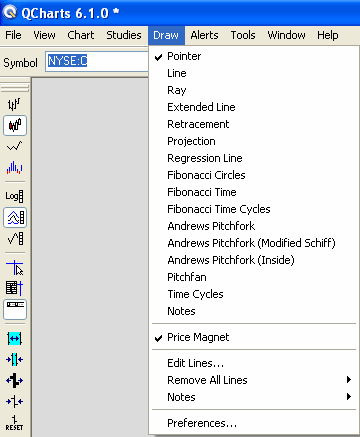
To apply lines on the Chart Window go to the draw menu at the top of QCharts. 
Select the drawing tool you wish to use. Once selected your mouse cursor will change to a pencil icon . Single click once to select the starting point and drag your cursor to the end point and single click again.
Changing the interval on a Chart Window
Changing the interval of a chart window can be done in a number of ways besides pulling down the list and picking one:
Arrow Keys
Click on the interval box of the Expression Toolbar and then change intervals with the up and down arrow keys.
Custom Intervals
Any time a chart window is selected, a typed number will appear in the interval box; press enter to change the interval to that number of minutes. Custom intervals are listed at the bottom of the interval pull-down menu.
Symbol and Interval
When a Chart Window is selected, any letter you type will appear in the symbol box. When you finish typing the symbol, type a comma to move the cursor to the interval box, where you may type an interval at the same time. Numbers are for minute intervals, and the first letter of Daily, Weekly, Monthly, Quarterly, or Yearly will suffice. For example: ICE,10 will specify ten-minute intervals of ICE, and ICE,M will specify a monthly interval.
How do you zoom in and out on a Chart?
To zoom in and out on a chart, hold down the left mouse button on the time/date (x-axis) of the chart and drag left to zoom out and right to zoom in. The same can be done for price scale (y-axis).