This article provides an overview for using the chart window in version 12. For chart studies and drawing tools, click here.
New Chart
Insert Symbol / Multiple - Overlay Symbols
Insert Interval
Symbol and Interval Linking
Data Window
Time Templates
Style Templates
Chart Properties
Edit Chart
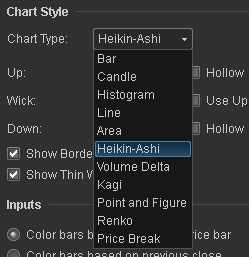
Chart Type
Trading
New Chart
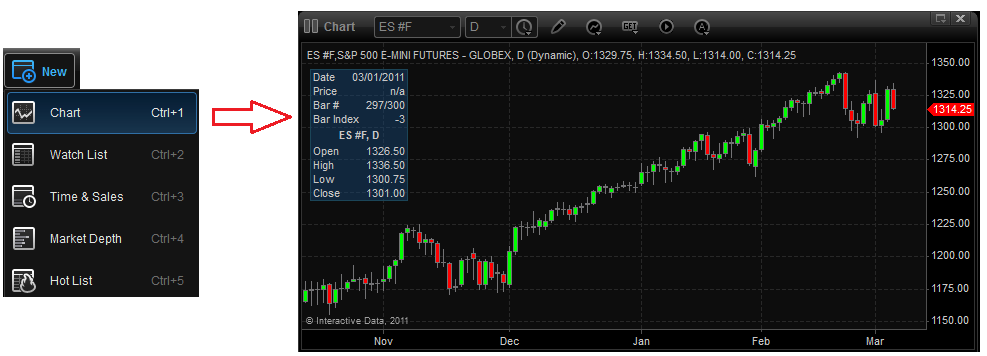
To open a new chart, click the New button from the main menu then select Chart. a keyboard shortcut (Ctrl +1) is also available.
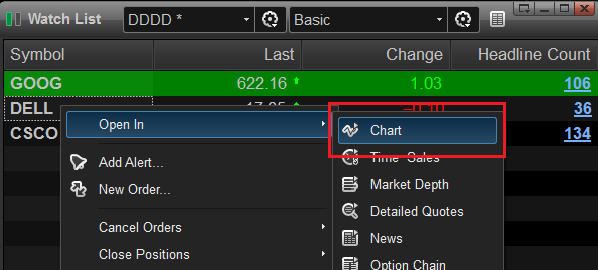
Alternatively, when you are using a window such as the watch list you can right-click a symbol from the other window types and a drop-down menu will display. The menu will display an option to open a chart. click Chart and a new chart window for that issue will display.
Insert Multiple Symbol s / Overlay Symbols
To insert multiple symbols in a chart window, right-click the mouse inside the chart and select Insert Symbol. The "Insert Symbol" window will open prompting the boxes to insert the desired symbol and interval, it will also display the box to select the chart type for the new symbol.

Located to the right of the symbol and interval boxes you will see the "as main symbol" and "as main interval" boxes. by leaving the "as main symbol and " as main interval un-checked, the symbol and interval will be independent from the main symbol / interval.
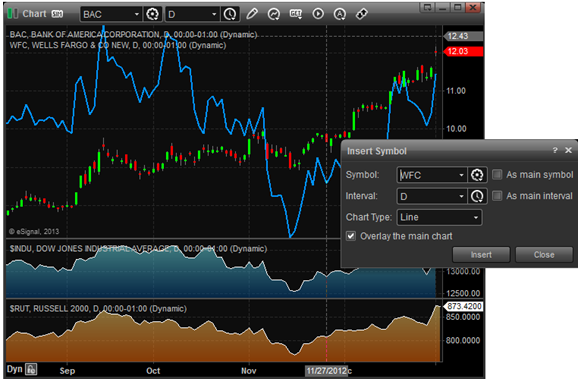
The image above displays two symbols $INDU and $RUT in their own, while WFC is overlaid on top of the main chart.
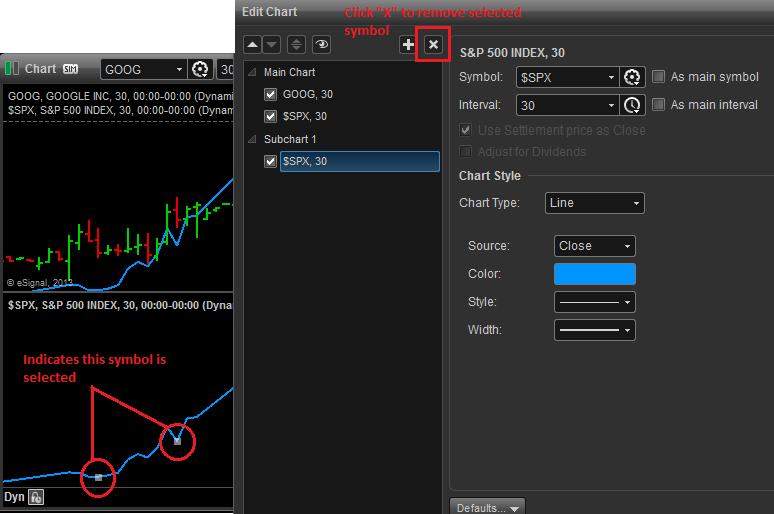
To remove an overlaid symbol from the main chart or from a sub-chart, click the Line chart or Bars for the symbol you wish to remove, the line will be selected (little square boxes along the line or bars will appear), press the Delete key in your keyboard. you can also remove the inserted symbols using the "Edit Chart" window and selecting the symbol that will be removed and clicking the "X" located on top of that column.
Insert Interval
There are two methods for entering a chart Interval. The Interval can be changed by typing the interval number (i.e. 5 if it is going to be a five minute chart) or by typing a comma (,) to enter non minute intervals such as D (daily), W (weekly), M (monthly).
The second way to enter an interval is by clicking on the Interval
 icon located next to the interval box.
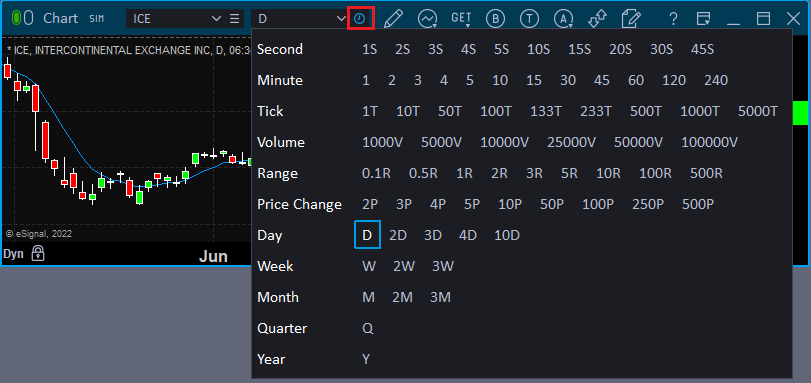
Note: Tick-based Intervals such as Range bars, Tick bars, Volume bars, etc. have been optimized and are now built much faster and use a lot less memory.
Symbol and Interval linking
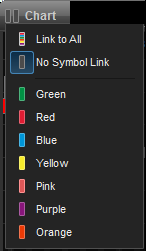
The Symbol linking feature allows you to link multiple windows together. Once the symbol link has been activated, a symbol change in one window will be automatically reflected in all of windows that have been linked with the same color. To link two or more windows together just click on the Symbol linking button in each window and select the same color. If you want to make sure your chart is not link, click the Symbol linking button and select 'No Symbol Link'.
Interval linking makes possible to link two or more chart windows together by the interval. Once the interval linking has been activated, changing the interval in one chart will change the same interval across all linked charts. 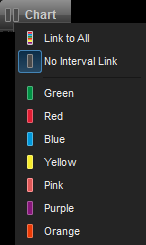
Time Templates
Time Templates allow the user to set templates for specific start and end times that will display data in the chart window. Time Templates can also be used to specify the number of days or bars that the chart will load at any given time. To edit or create a Time Template, Right-click the mouse inside the chart window and select to Time Templates, then click on Edit and the window below will appear: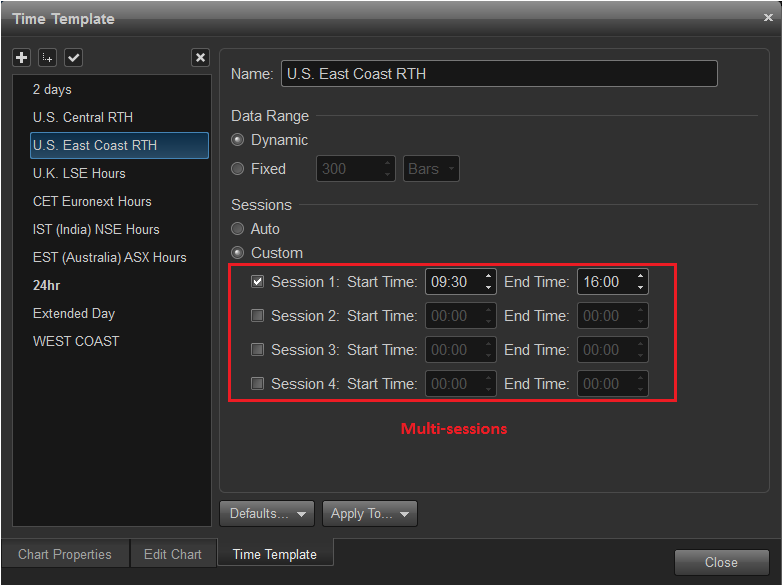
To create a new Time Template, click on the plus sign  in the top left hand corner of the Time Template window.
Name: In the name field, provide a name for the new template.
Data Range: Use this feature to request a range of data to be loaded on the chart. Rather that scrolling back to request more data, a set amount of data can be preloaded on the chart using this feature. Dynamic is checked by default. Uncheck this setting if you wish to use the static view (quotes are not updated). You can choose to load a set number of days or bars using the drop down menu.
Sessions: Auto will set the start and end times based on when the exchanges opens and closes. You can customize the start and end times by checking Custom and entering the times manually. You can set up to four different time templates. Click Close to save changes.
To load your time template on the chart window, Right click in the chart window, go to Time Templates and then select your Time Template.
Style Templates
Style Templates allow you to customize a window in eSignal in terms of color, font, indicators and more, Save those settings as a default to open in a new chart. Also, you can save those settings as a file that can be applied to any chart.
Please note, any new chart window opened will retain the symbol from the last style template that was set as default. Applying a style template to an existing chart will not change the symbol on that particular chart.
You can access the Style Template feature by clicking the style templates icon at the top of the chart or by right-clicking the mouse in the chart and selecting Style Templates in the drop-down menu.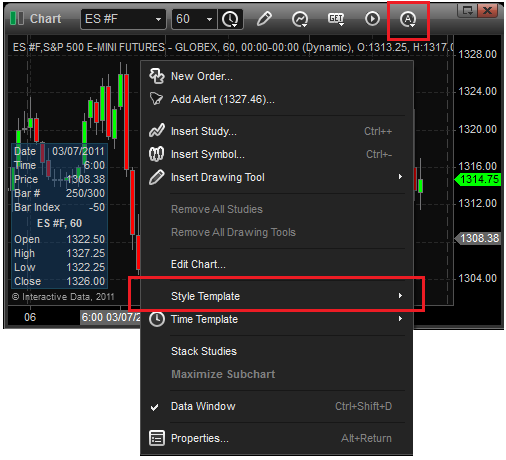
Click here for more information about Style Templates.
Chart Properties
To access the chart properties, right click the chart and select Properties. This menu allows you to further customize the chart settings which include:
Background and Grid
Scales
Data Window
Cursor
Status Line
Snapshot Bar
Trading
Background and Grid
There are several background color settings that can be customized in this menu along with grid line style (solid vs. broken lines).
Session Breaks: This allows you to add a vertical line to your chart that will show when the market sessions has completed.
Insert Drawings over Series: When this feature is turned on every time you use a drawing Tools the drawing will be over the Price Bars/Candles in the chart.
Watermark: This feature will add the Symbol and Interval to the background of the chart window.
Enable Chart Labels: You can also toggle the different Chart Labels on/off.
Chart Labels
When enabled the chart marker labels will display an icon at the bottom of a chart window indicating when a stock splits, issued dividends, earnings, or where it hit its 52 week high/low. The actual amounts are displayed on the label, but if you’d like to see the date as well, just hover your mouse cursor over the marker to see those details in the tool tip.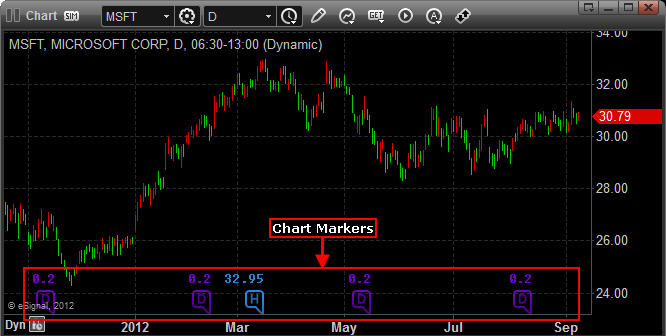
Scales
The Scales refer to the area at the very bottom (x-axis) which is called time scale and right (y-axis) of the chart, which is called price scale. you can change settings for the scales by opening Chart Properties and then clicking Scales.
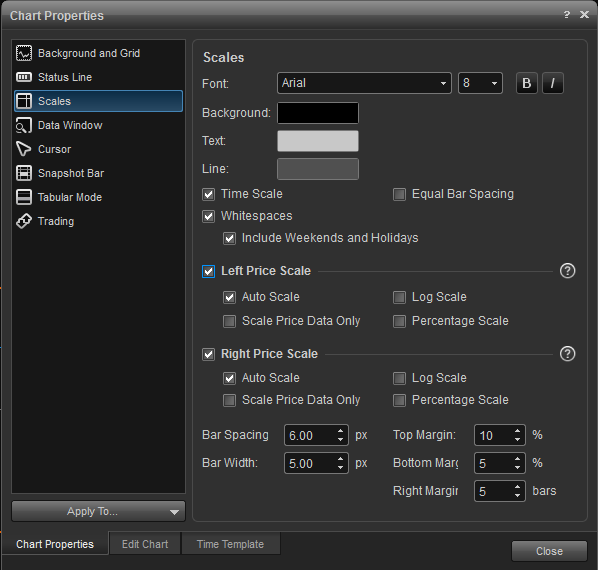
The scale properties allows you to change the scales background color and text configuration. You can also set the price scale to display on the left side or on the right side, and remove the time scale.
Checking the box for whitespace, will create a space any time there is a bar period without any activity instead of eliminating each of these periods from the chart. There is the also an option to include spaces for weekends and holidays the value of this is when you want to be able to maintain trendline slopes or parallel lines when switching time frames. Since this is just space created for intervals periods that don't really exist for a symbol, you will not be able to start or end any drawing tools in a blank area.
Also, in the scale properties window you can increase or decrease the top, bottom and right margins and change the bar spacing and bar width to ensure bars and candles are drawn and spaced evenly throughout the chart; opposite to smooth scaling, which allows for unlimited compression.
Data Window
The Data Window is the small information panel within the chart window that displays information such the symbol, date, time, open, high, low, and close. It also displays values for studies that are applied to a chart. You can click and drag the Data Window to move it within the chart.
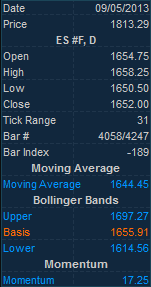
To customize the data window settings, right click the chart or data window and select Properties. on the left hand side, make sure that data window is selected. Set the data window to be visible, auto-hide it, or remove it. Change the font type, style, and size as well as the colors for the window background and text.
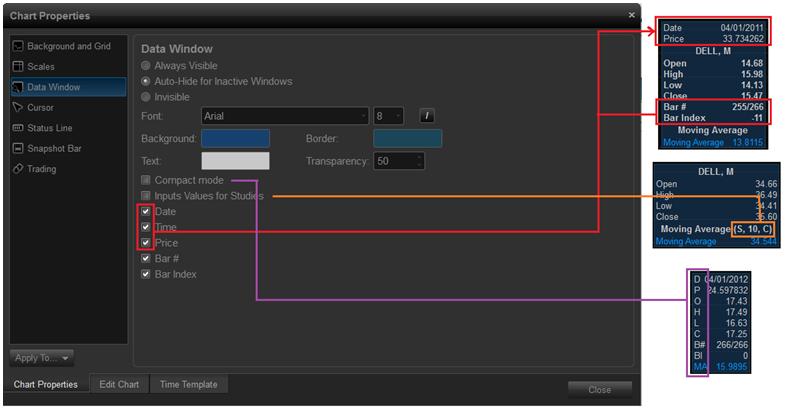
Compact Mode allows you to abbreviate the labels to save on space.
Inputs Values for Studies will display the study inputs found under the Edit Chart, Properties tab.
Choose to display or hide the Date, Time, Price.
Bar# counts the total number of bars loaded on the chart and identifies the bar # where the cursor is placed. If there are 100 bars loaded and your mouse is hovered over the first bar the display would read 1/100. If you hover over the current bar the display would read 100/100.
Bar Index counts the current bar as 0. Moving backwards, it will act as a bar counter. For example, if you move 5 bars behind the current bar the display will read -5.
Transparency allows you to see through the window so that the bars in the Chart Window do not get hidden behind the Data Window.
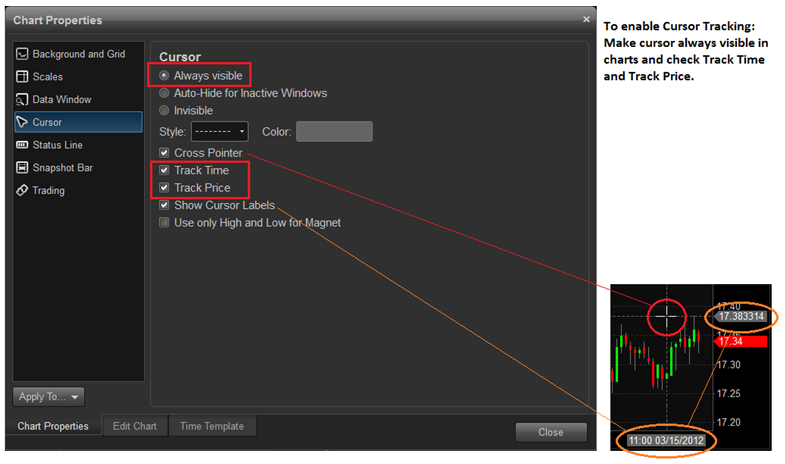
This settings allow you to customize the chart cursor. You can set the cursor to be visible, invisible or to auto-hide for inactive windows. Checking the box for Cross Pointer will display a little cross in the location where the horizontal and vertical lines cross wherever the cursor is pointed. You can edit the style (solid vs. broken lines) and color of the Cross Lines. Cross pointer turns displays a cross in place of the white pointer arrow. Show Cursor Labels displays the labels in the X and Y axis for date/time and price.
You can enable Cursor Tracking by making the cursor visible by checking Always Visible and checking boxes for Track Time and Track Price in charts.
Status Line
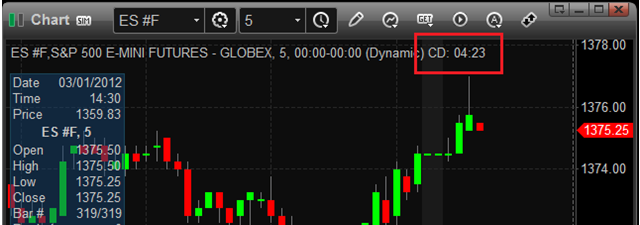
Located at the top-left corner of the chart area, the Status Line shows the Symbol, Description of the symbol, Interval in use, and the Time Template settings. The Status Line contains also the Countdown which displays the amount of time left before a new bar appears. In our example below, we have a 5 minutes chart for the E-Mini S&P 500 and the countdown started counting regressively from 5:00 for the current bar. To enable the countdown, right click the chart and select Properties. Under the Status Line menu on the left side add a checkmark to Show Countdown.
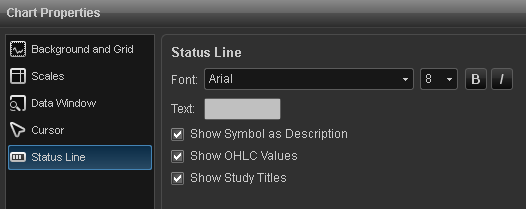
Use this menu to edit the font type, style, and size. Toggle the OHLC values and study titles by checking/unchecking the corresponding boxes. You can also choose to display the symbol vs. description.
Edit Chart
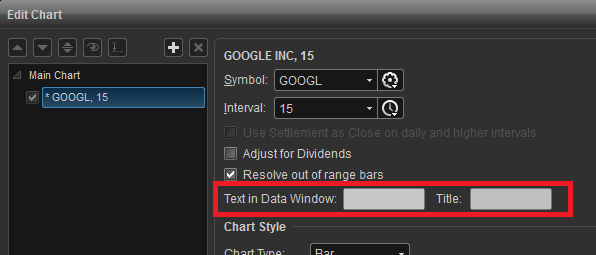
To access the Edit Chart window, right-click the mouse inside the chart, then select edit chart. The Edit Chart window will allow you to edit the symbol and interval as well as the chart style and bar color. You can change the symbol and interval using this menu.
You can choose to display the color of the bars based on current price bar or Color bars based on previous close. This last setting will set the bar to display green if the close for that bar is greater than the close in the previous bar, or display it red if the close for a specific bar is lower than the close in the previous bar.
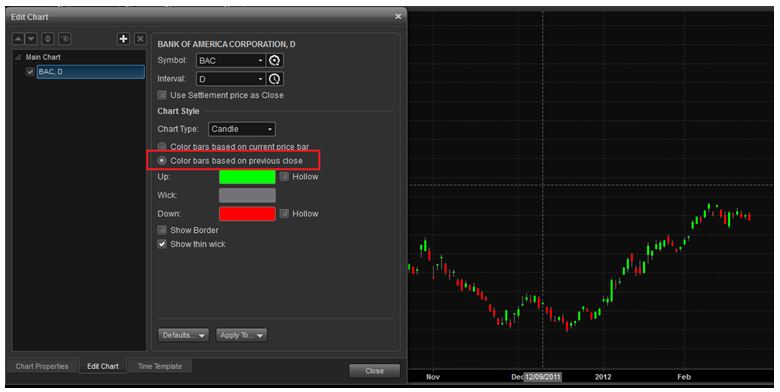
For daily charts, you can choose to use the settlement price as the close instead of the last price as the close. To use the settlement price check the box for Use settlement price as close. Please note that this feature only affects symbols that have large trading periods after the settle is released such as the Dax, Gold, and Silver futures. Currently intraday charts don't have the option of toggling the settlement price on.

Chart Type
Snapshot Bar
The Snapshot Bar displays the Open, High, Low, Last, and Change for the symbol in the chart.

You can add or remove the snapshot bar by right-clicking the mouse inside the chart and selecting
Trading
You can customize the display of your bid/ask lines, Executions, Positions, and Orders in the chart properties trading window:
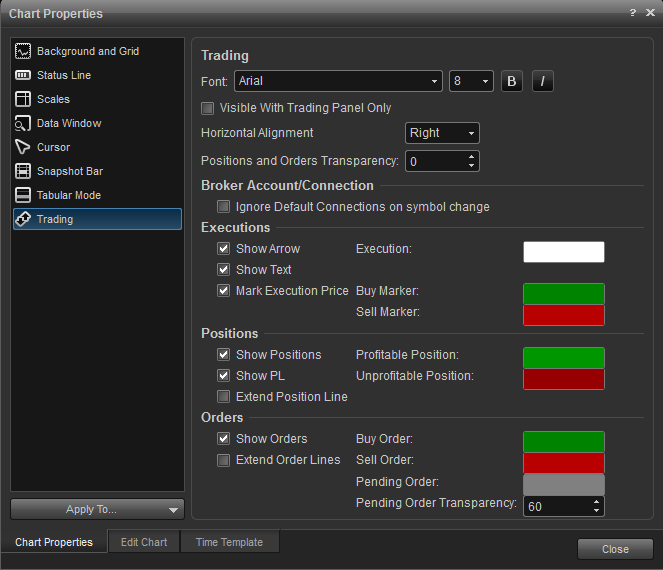
Trading: You can make the bid/ask lines, executions, positions, and orders to display in the chart only when the trading panel is open by checking the box for Visible with trading panel only.
Bid/Ask Lines: check box to display bid/ask lines. you can set the horizontal alignment right, left, center.
Executions: check boxes to display arrows and text.
Positions: check boxes to display positions and pl.
Orders: check boxes to display the orders and extend the line displaying the orders.
