How to Open a Watch List Window
Title Bar Components
Adding Symbols, Columns and Comments
Adding EFS Studies / Formulas in a Watch List
Watch List Right-Click Functions
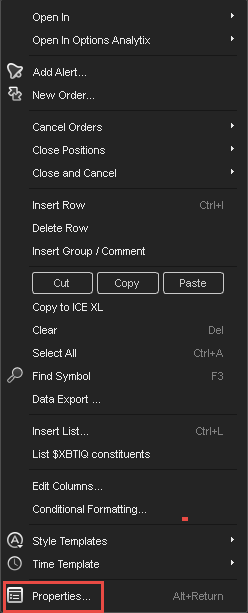
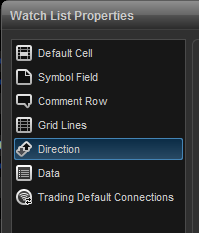
Watch List Properties
FAQs
Overview
The Watch List allows you to track your symbols in a spreadsheet format. The Watch List was known as the Quote Window in previous versions of eSignal.
How to Open a Watch List Window
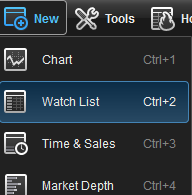
To open a Watch List window, go to the main menu and select New, then click Watch List. A keyboard shortcut (Ctrl+2) is also available.

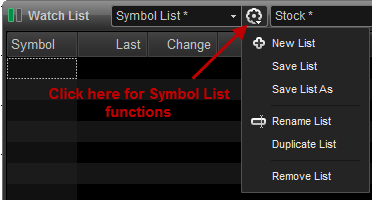
The Symbol List drop-down menu stores sample and user created symbol lists. Create a new Symbol List by selecting New List from the menu shown in the screenshot below. Once you have entered all your symbols, select Save List or Save List As to save the changes. This menu includes Rename List, Duplicate List, and Remove List.
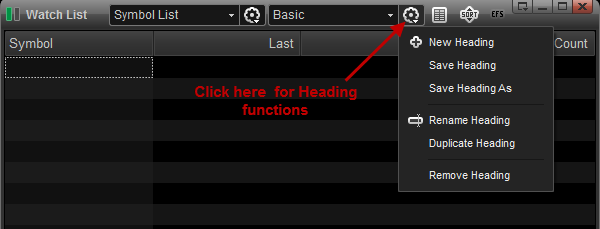
The Headings box allows you to select from a list of pre-set headings designed for stocks, futures, options and other issue types. There is also the ability to create and save new custom headings along with creating, saving, renaming, duplicating, or removing existing ones.
The Summary Mode icon
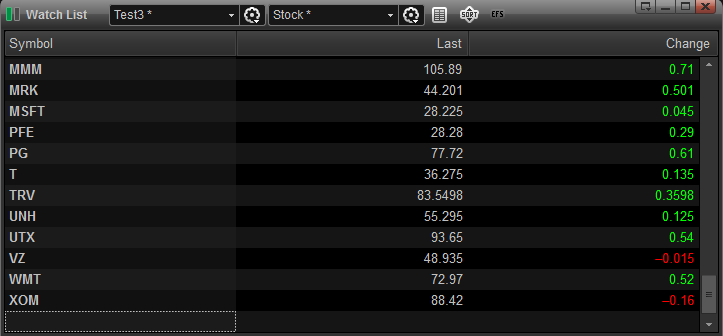
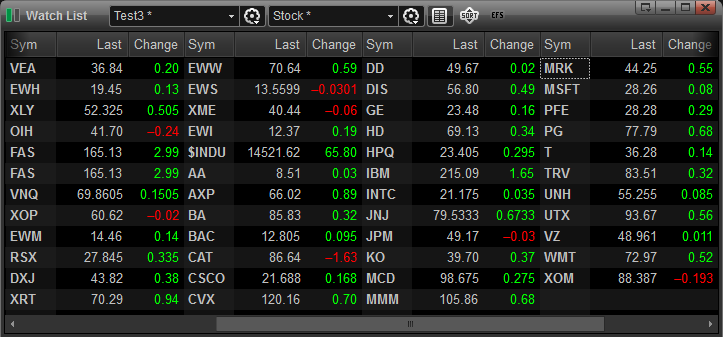
The Summary Mode displays multiple column headings in the same row which allows more symbols to be displayed in the same space.
The Column Data Sort or Sorting Panel icon

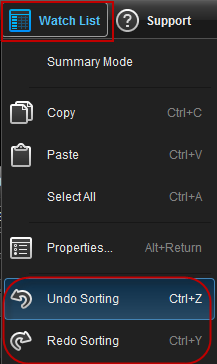
Sorting can also be done manually by left-clicking the mouse once in the column heading that you want to be sorted. Sorting is done alphabetically for fields that contains text and numerically for data fields. Click Watch List from the main menu to undo or redo sorting.
Enter a new symbol by clicking on any empty row under the Symbol column. Type the symbol and click Enter.

To add a new column to the watch list, right-click the mouse over an existing field and select Add Columns to open the list of available columns.
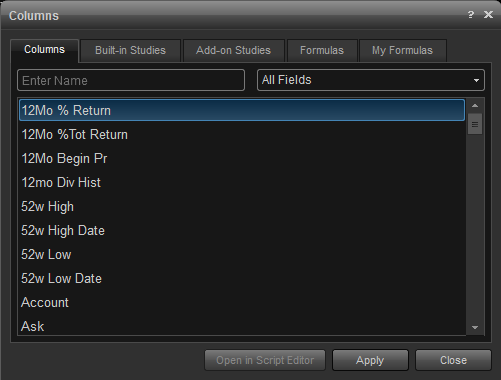
Once the field has been added to the window, you can click-and-drag the new column to a new location, if desired.
Click here for more information on column headers.
Adding Comment Columns
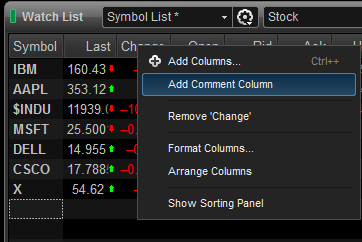
To add the comment column, right click the watch list heading area (where it says Symbol, Last, Change, etc.) and select Add Comment Column from the dropdown menu:
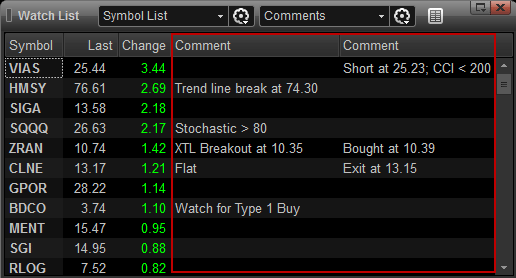
You can add multiple Comment columns:
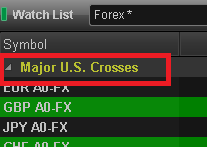
You can also enter comments to serve as a category heading by entering a # sign followed by the text in the Symbol column. In the example below, major U.S. Crosses has been entered as a comment:
One of the major new features to be added to eSignal 11 is the ability to add EFS studies as columns into the Watch List. You can add a study or formula to your Watch List in the same way that you would add a new column. Right-click an existing column header and select Add Columns. You'll notice tabs for Built-in Studies, Formulas, Add-on Studies (subscription based) and My Formulas.
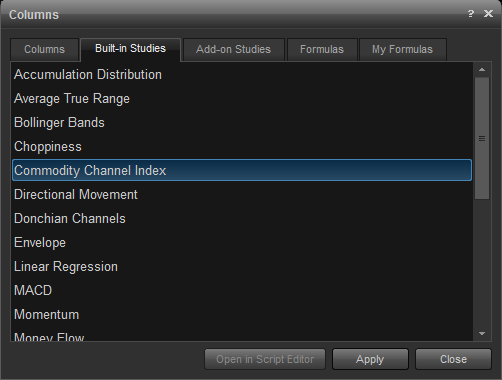
Select the study you wish to add and click Apply. Multiple studies can be added from this menu.
Click Close once you're done adding studies. The selected study or studies will appear in your Watch List:
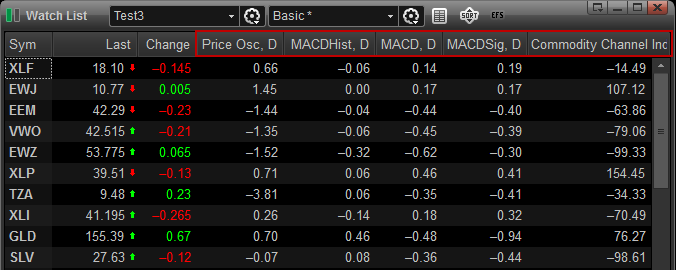
You can change the parameters of the studies in the watch list by right clicking on the column header and then selecting Edit Columns.
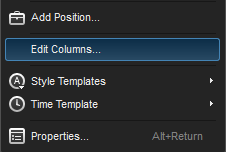
In the Edit Columns window, select the study that you would like to edit, which in this example, is the Commodity Channel Index:
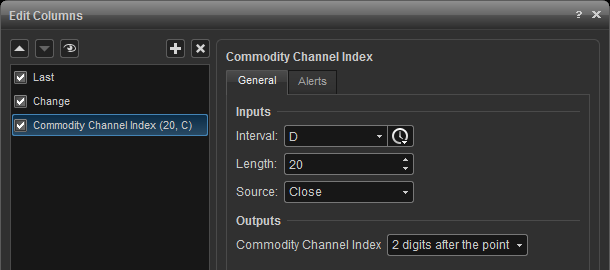
You can edit the study's interval, length, source and outputs (price, volume, and the number of decimal places).
Time Templates for EFS Studies / Formulas in Watch List
Time templates allow you to control the number of bars that load and the specific hours/trading sessions used in the calculation. By default, the program loads 50 bars worth of data to create the calculation on studies. time templates in the watchlist relate to studies only, this will not affect the last price or the volume columns. for more information on time templates, click here.
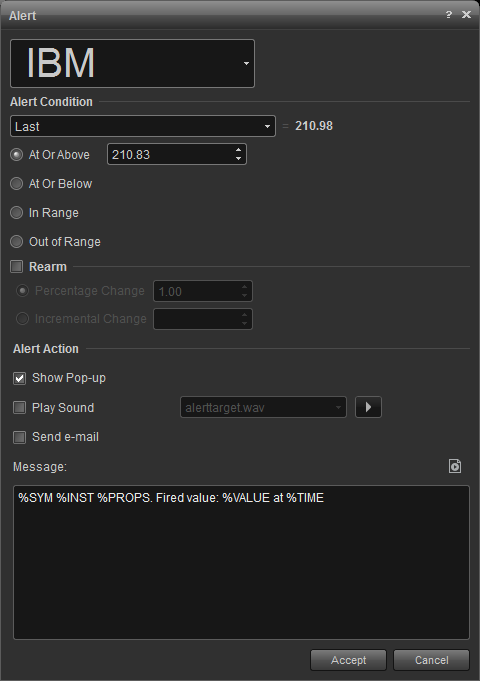
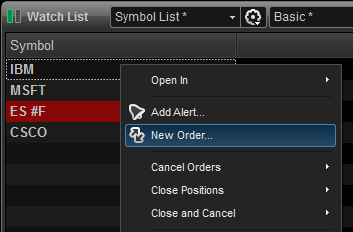
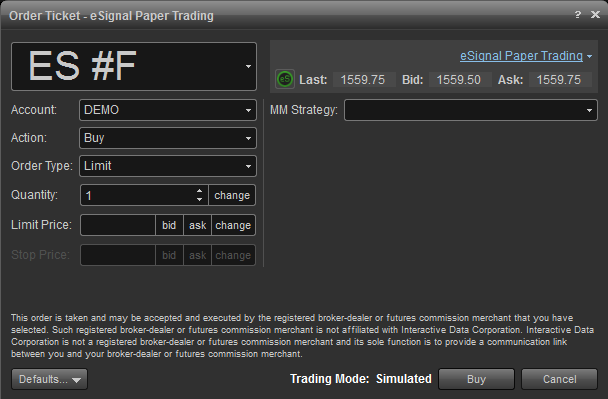
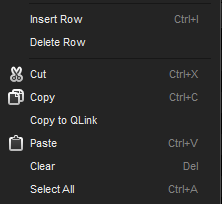
Watch List Right-Click FunctionsYou can copy and paste symbols, insert and delete rows, as well as insert a Hot List, Sector List or Autolist, by right-clicking the mouse inside the watch list window. right-click any symbol in the Watch list to open a Chart, Time & Sales, or Market Depth window.
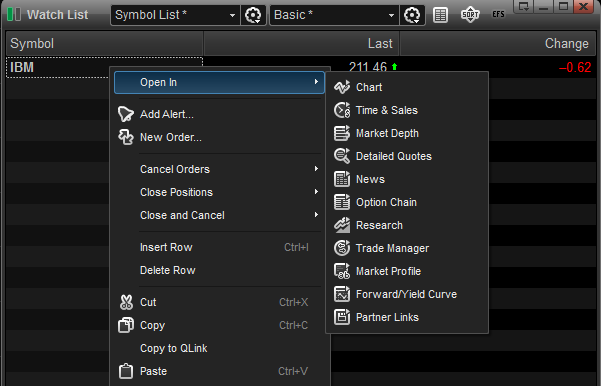

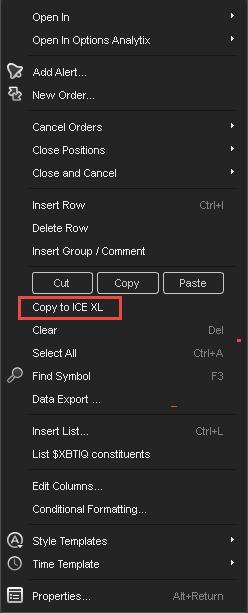
Copy to ICE XL
ICE XL subscribers will have the Copy to ICE XL selection available on the right-click menu. this functions allows you to copy rows from the watch list into ice xl (excel). only column headers that correspond to ice xl fields will be copied into excel. click here for more information on ice xl.
To copy to ICE XL, highlight the row or rows from the Watch List.


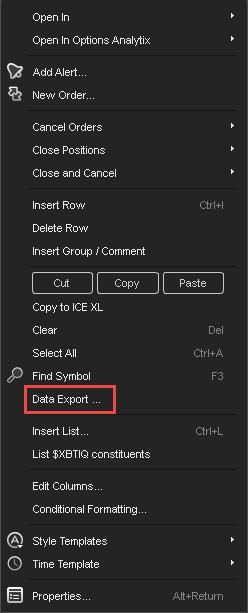
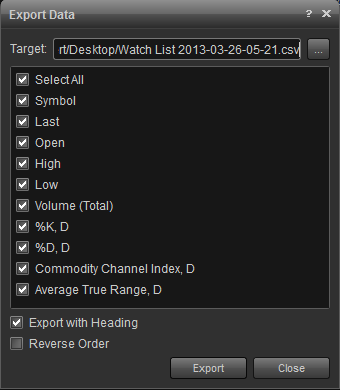
Export Data

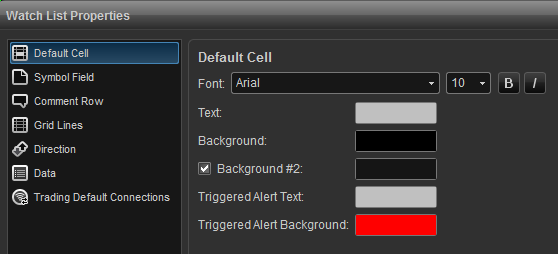
The Default Cell menu allows you to specify the font type and size along with a button for bold and italics. There are color settings which include text and background. Background #2 is checked if you prefer alternating colors for each row. Additionally, you can edit the text and background colors for triggered alerts.
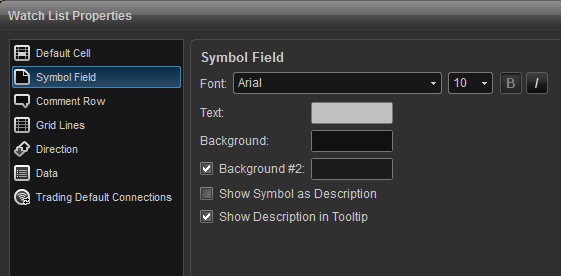
Symbol Field
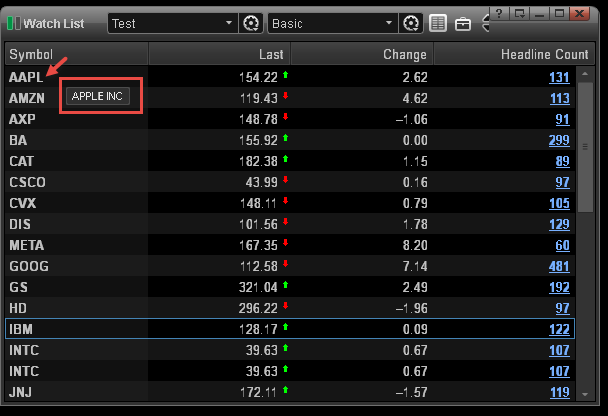
Change fonts, colors, and toggle between displaying the symbol or description of the listed issues. Background #2 is checked if you prefer alternating colors for each row. You can select show Symbol as Description which will display the description vs. the symbol.
Comment Row
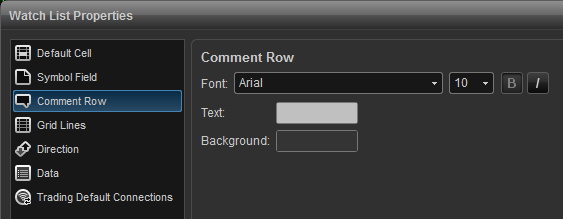
The Comment Row menu allows you to specify the font type and size along with a button for bold and italics. text and background colors can be edited here as well.
Grid Lines
Use this menu to add vertical and horizontal grid lines and to customize the grid line color.

Focus Outline
Change the color of the active row in all grid-based windows. For example, to change the color of the active row in the Watch List, right-click the mouse inside the Watch List and select Properties. You can change the color of the row's frame and background.
 .
.Direction
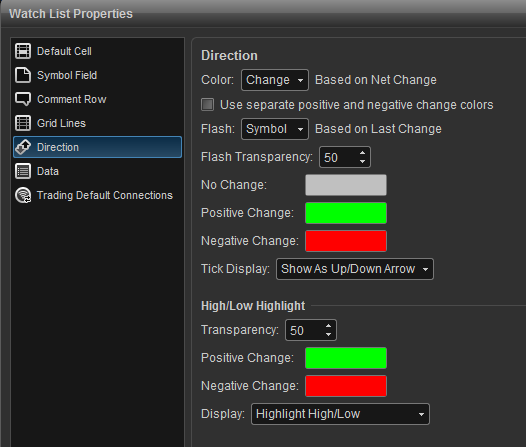
Change the color and display of when a tick is up or down using this menu. The color field allows you to choose a column (symbol, last, change, all cells) for the color display which is based on net change. Green (up) indicates a positive change, red (down) indicates a negative change, and gray (zero) indicates no change. Tick Display allows you to toggle between using arrows or +/- for changes up and down.

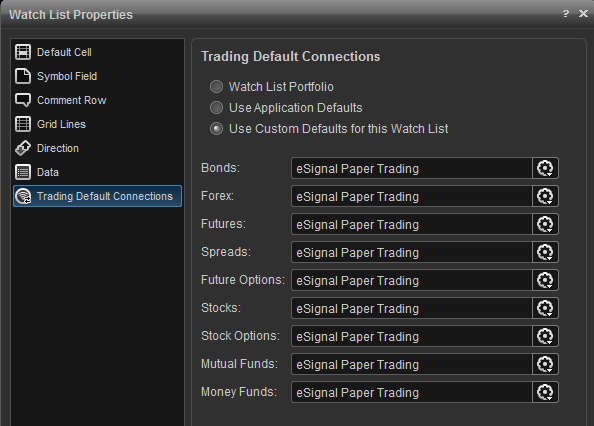
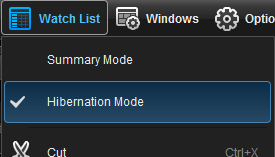
Data Hibernation is the ability for the eSignal application to put symbols to sleep that aren’t being used. By default, hibernation is turned on. However, you can turn hibernation off on your Watch List by selecting the Watch List menu at the top of eSignal and then uncheck Hibernation Mode.
How Do I Add Net Order Imbalance to the Watch List Window
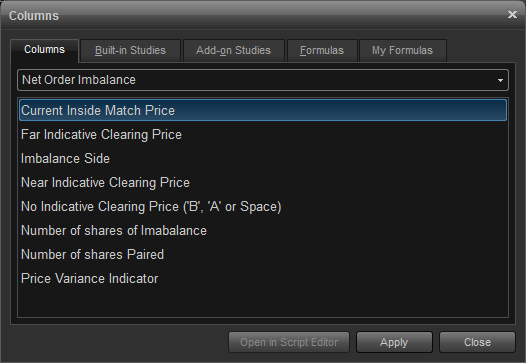
Net Order Imbalance is now available in the Watch List. You must subscribe to NASDAQ Total View to receive this data. Net order Imbalance gives a look into the supply and demand forces that affect the opening and closing prices (i.e. the NASDAQ (opening and closing cross data). Once subscribed, right-click the mouse over an existing field and select Add Columns to display the list of available columns. Use the dropdown menu and select Net Order Imbalance for a list of available fields:
